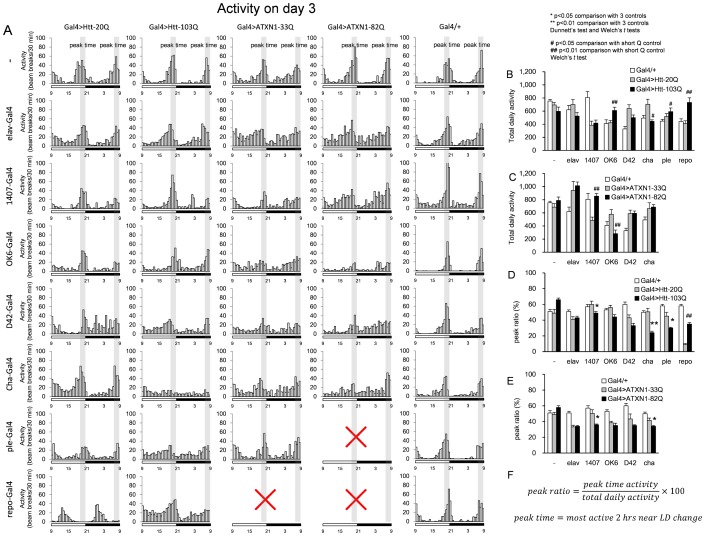
Figure 4. The daily activity was recorded for multiple fly models (A).
Fly activities (number of beam breaks) during Zeitgeber rhythm were recorded on the 3rd day and the ratios of the total beam break times are plotted. The genotypes are indicated on the left side and on the top of each graph. The LD cycle is indicated under each graph using open (light) and filled (dark) bars; the time is described below the bar. The peak times (7:00–9:00 and 19:00–21:00) are also indicated in each graph. Quantitative comparisons of total daily activity (B, C) or peak ratio (D, E) among three groups (Gal4/+, Gal4>normal polyQ, Gal4>mutant polyQ) are shown for Htt (B, D) and ATXN1 (C, E). Each bar represents the mean ± SE. Single and double asterisks indicate significant recovery compared to the three controls (Gal4, Gal4>normal polyQ, promoter negative-Gal4>mutant polyQ) (p<0.05 and p<0.01, respectively). # and ## indicate values significantly different from the short Q control (p<0.05 and p<0.01, respectively). The formula to calculate the peak ratio (F). The numbers of flies tested are listed in S1 Table. The results of the statistical analyses are listed in S5 Table.

