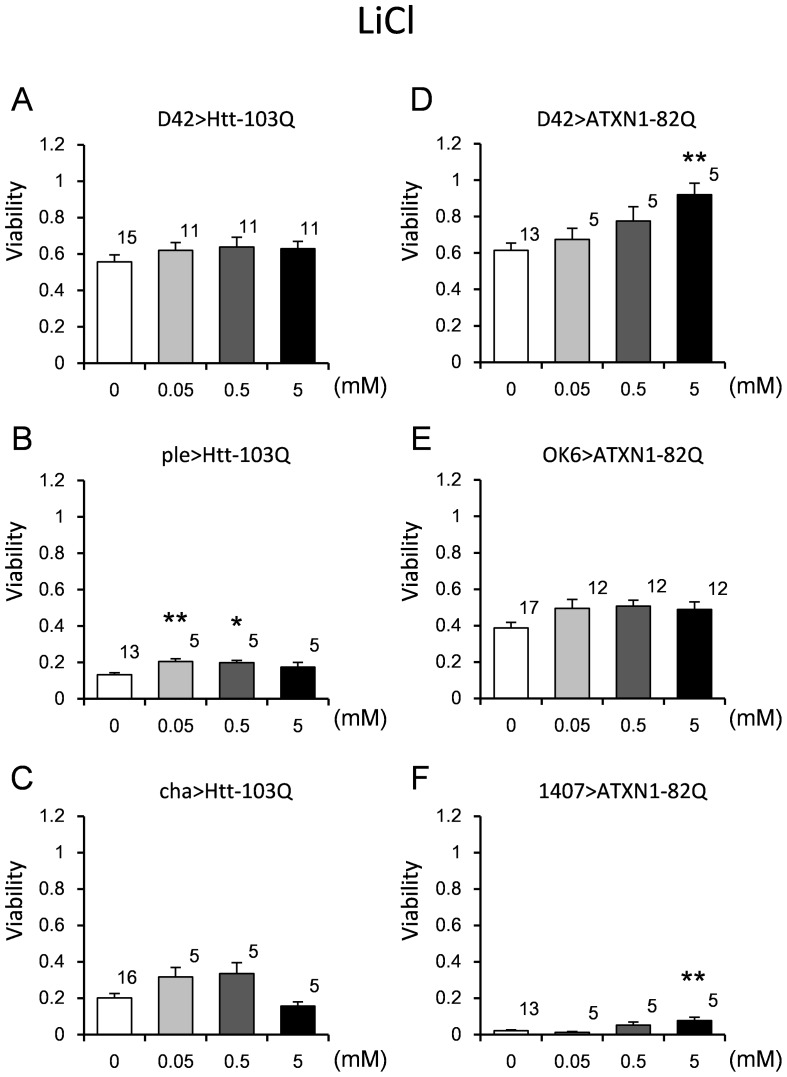
Figure 6. The effect of LiCl on the viability of the HD and SCA1 models.
The viability was calculated as described in the “Materials and Methods” section. The concentrations are indicated on the X-axis, and the viability is indicated on the Y-axis. Three HD models (A–C) and 3 SCA1 models (D–F) were employed. The genotypes are described within each graph. Each bar represents the mean ± SE. The number of vials tested is indicated on the shoulder of each bar. Single and double asterisks denote significant differences (p<0.05 and 0.01, respectively). The results of the statistical analyses are listed in S6 Table.

