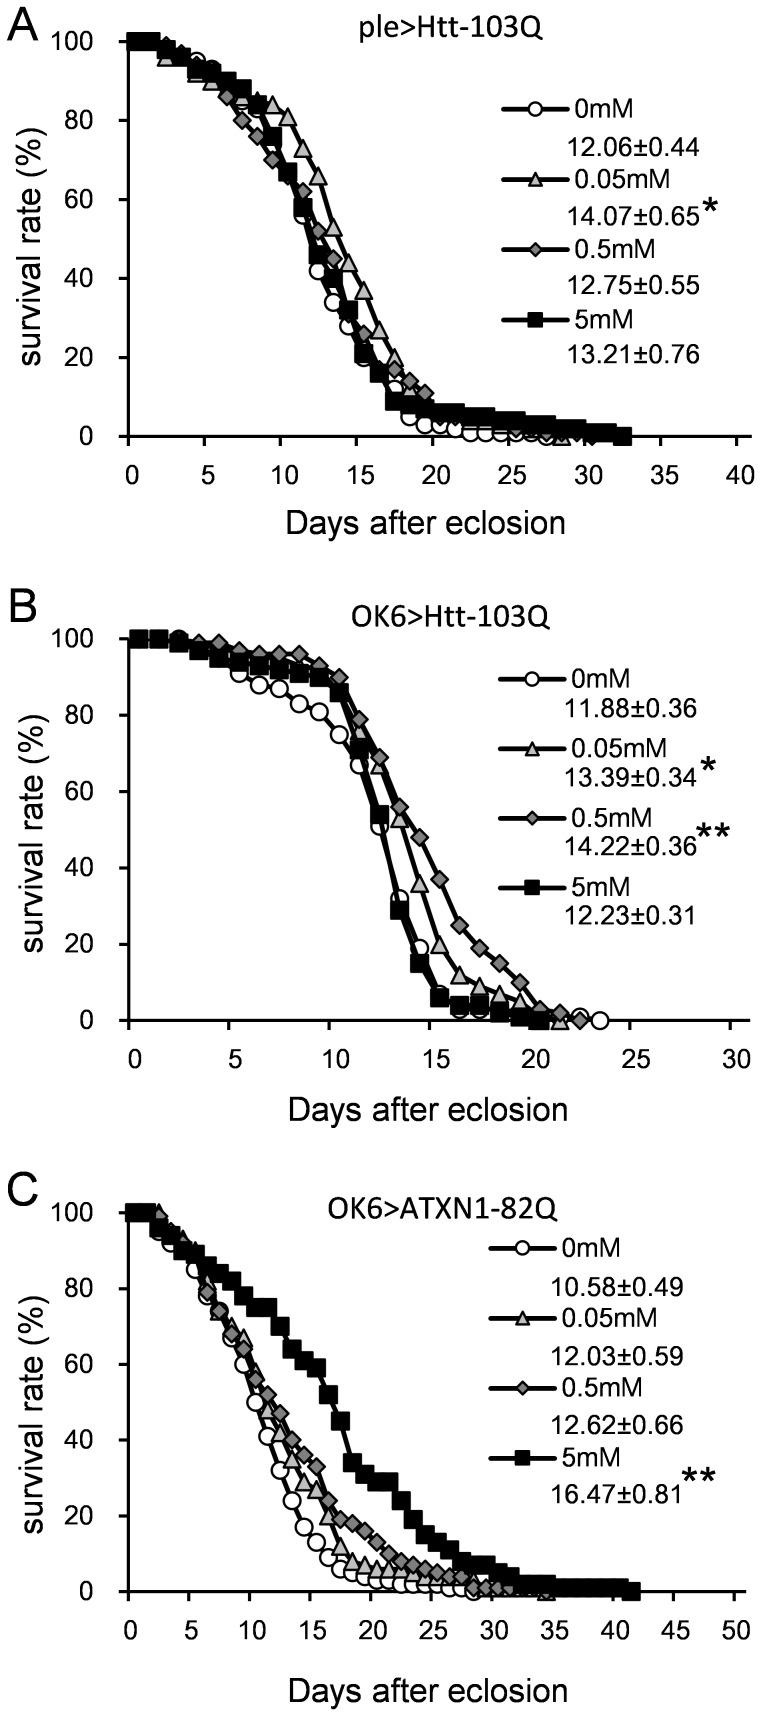
Figure 7. The effect of LiCl on the longevity of the HD and SCA1 models.
The X-axis represents days, and the Y-axis represents the percent survival. All lines in a graph represent the same genotype. (A) ple>Htt-103Q. (B) OK6>Htt-103Q. (C) OK6>ATXN1-82Q. The mean lifespans (days) ± SE are shown below each symbol legend, with n = 100 for each line. Single or double asterisks indicate significant differences (p<0.05 or p<0.01, respectively). The results of the statistical analyses are listed in S7 Table.

