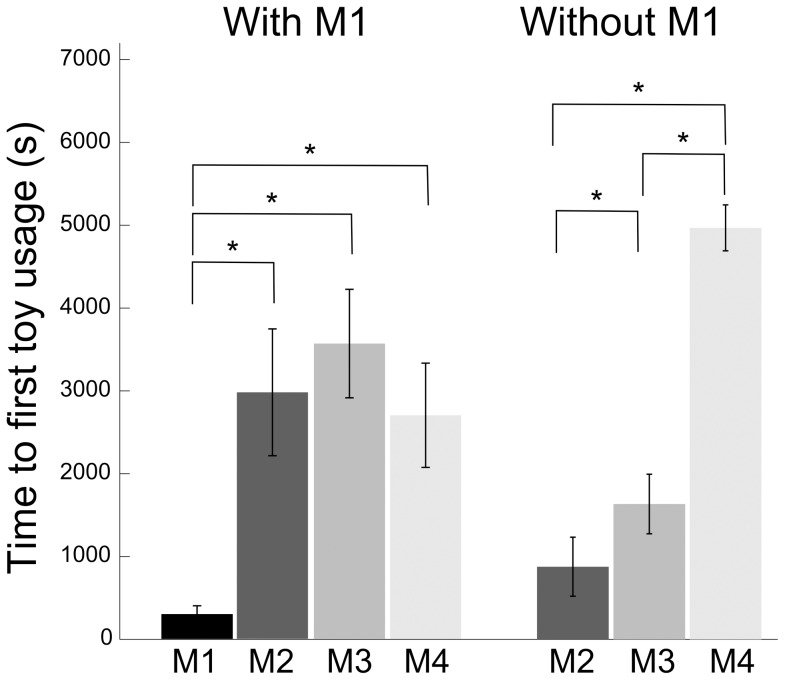
Figure 2. Hierarchy estimated from access to toys.
Mean delay between toy introduction in the home cage and first toy interaction event lasting>10 s with M1 presence (left panel, n = 11) and absence (right panel, n = 18) in the group. * indicate significant pairwise differences (Wilcoxon rank sum test p<0.05). M1 designate the most dominant monkey and M4 the most subordinate monkey as established through the classical water access test (see Materials and Methods).

