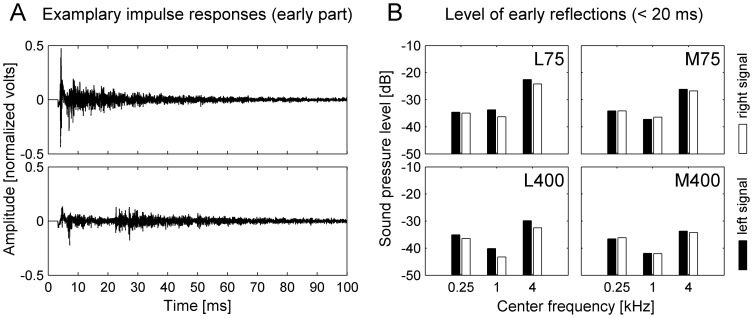
Figure 3. Illustration of the corridor's IRs and how they vary with position.
(A) Illustration of two exemplary IRs recorded at positions along the corridor's midline (with 0° orientation). The first 3.3 ms of the IRs (which contain e.g. the direct sound from the mouth to the ears) were cut away to account for the input-output delay of the setup. The vertical axis represents the amplitude of the IR in linear units, which was normalized such that the direct sound would have an amplitude of 1 V. Due to the symmetry of the corridor, the left signal and the right signal of the binaural room IR are visually not distinguishable at the resolution and size of the current figure. The figure demonstrates that the pattern of early reflections varies with the distance to the front wall of the corridor: For position M75, there is a peak at 4.4 ms, which represents the echo from the front wall at a distance of 75 cm. For position M400, there is a peak at 23.3 ms, which represents the echo from the front wall at a distance of 4 m. (B) Level of the early reflections for three two-octave frequency bands (with center frequencies of 0.25, 1 and 4 kHz). The analysis was conducted for the IRs from four different positions (M75, M400, L75, L400, all at 0° orientation). Only the early part of the IRs within the time interval of 3.3–20 ms was included. The vertical axis represents the effective sound pressure level of the reflections in dB relative to the direct sound (which was set to 0 dB). The figure demonstrates that the proximity to a lateral wall influences the pattern of early reflections: The level of the left ear signal is higher near the left lateral wall than in the middle of the corridor, especially in the high frequency range.

