
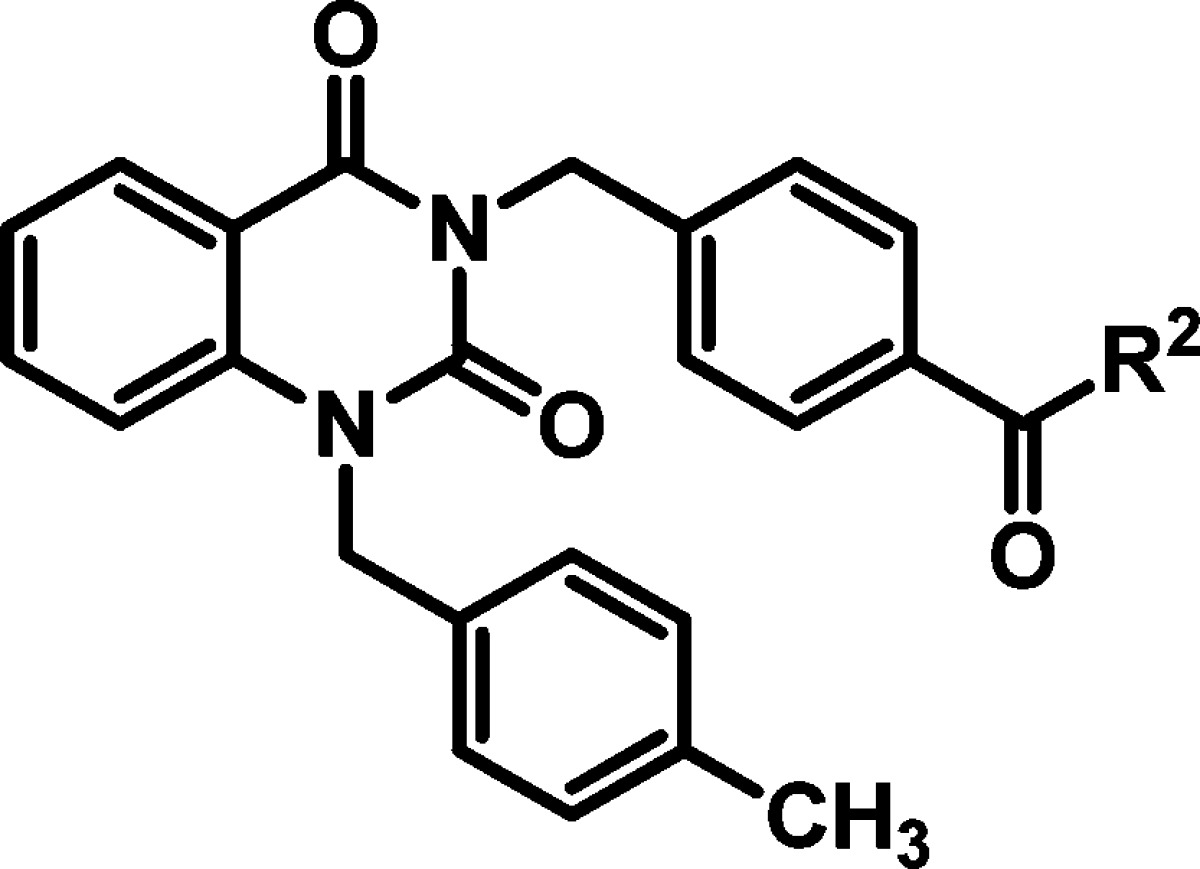
Table 2. hRSV CPE Assay Potency, Cytotoxicity, Selectivity Index,and Logarithmic Reduction in Viral Plaques for Analogs with Structural Variations in the (R2) Region of Hit Compound 2.
| entry | cmpd | R1 | RSV CPE potency ± standard deviation EC50 (μM)a | HEp-2 cellular toxicity ± standard deviation CC50 (μM)b | selectivity index (CC50/EC50) | viral titer reduction at 10 μM (log) |
|---|---|---|---|---|---|---|
| 1 | 2 | NH(CH2)3OCH3 | 2.1 ± 0.5c | > 50.0c | >23.8 | 4.2 |
| 2 | 24 | NH(CH2)3OCH2CH3 | 1.9 ± 0.2 | 8.5 ± 0.3 | 4.4 | NT |
| 3 | 25 | NH(CH2)3OCH(CH3)2 | 2.0 ± 0.2 | 19.3 ± 0.9 | 9.8 | NT |
| 4 | 26 | NH(CH2)3N(CH3)2 | 9.5 ± 0.4 | 16.6 ± 1.5 | 1.8 | NT |
| 5 | 27 | NH(CH2)4OCH3 | 0.8 ± 0.05 | 6.5 ± 0.3 | 7.8 | 2.1 |
| 6 | 28 | NH(CH2)2OCH3 | 2.2 ± 1.4 | >50.0d | 22.7 | NT |
| 7 | 29 | NH(CH2)-(3-oxetane) | 0.7 ± 0.1 | 47.0 ± 1.9 | 66.1 | 5.1 |
| 8 | 30 | NH(CH2)-cyclobutane | 1.0 ± 0.08 | 7.6 ± 0.3 | 7.9 | 1.2 |
| 9 | 31 | N-morpholine | >50.0 | 17.5 ± 1.1 | <0.4 | NT |
| 10 | 32 | N-pyrrolidine | >50.0 | 5.4 ± 0.3 | <0.1 | NT |
| 11 | 33 | N-piperidine | >50.0 | 7.3 ± 1.3 | <0.2 | NT |
| 12 | 34 | NHCH3 | 2.2 ± 0.9 | 45.3 ± 1.7 | 21.1 | NT |
| 13 | 35 | N(CH3)2 | >50.0 | 10.1 ± 0.2 | <0.2 | NT |
| 14 | 36 | NH-tert-butyl | 0.7 ± 0.03 | 8.4 ± 0.3 | 12.1 | 5.5 |
| 15 | 37 | NH-cyclohexyl | >50.0 | >50.0 | NA | NT |
| 16 | 38 | NH-phenyl | >50.0 | >50.0 | NA | NT |
| 17 | 39 | NH-benzyl | >50.0 | 41.8 ± 7.9 | NA | NT |
| 18 | 40 | NH-CH2-2-furyl | >50.0 | >50.0 | NA | NT |
| 19 | 41 | NH-2-thiazole | >50.0 | >50.0 | NA | NT |
| 20 | 42 | NH-4-pyridyl | 1.0 ± 0.04 | 1.8 ± 0.4 | 1.8 | 3.5 |
a
Data were an average of ≥3 experiments.
b
Data were an average of ≥2 experiments.
c
Data were an average of outcomes from two separate lots of compound 2.
d
Data were obtained from a 3-day exposure experiment versus 5-day duration due to precipitation of compound after 3 days. NT = not tested; NA = not applicable. Data were analyzed using Microsoft Excel 2010.