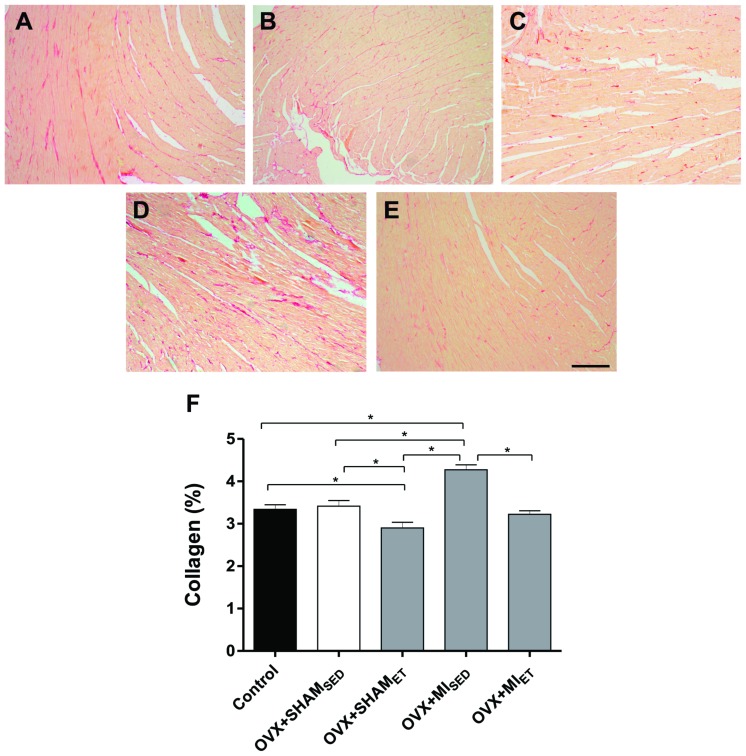
Figure 5. Interstitial collagen deposition evaluation in rat hearts.
Representative images of histological sections stained with Picrosirius of Control (A), OVX+SHAMSED (B), OVX+SHAMET (C), OVX+MISED (D) and OVX+MIET (E) groups. Data are expressed as mean ± SEM (n = 7). *P<0.05. Magnifier 400x. Bar: 200 µm.

