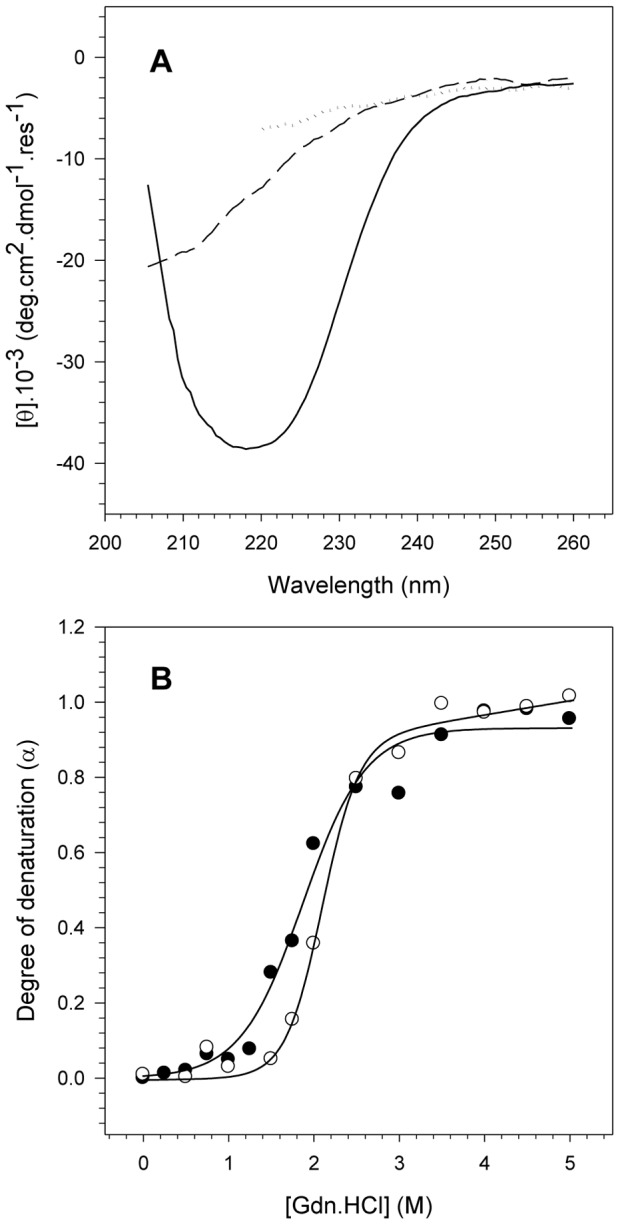
Figure 3. Analysis of the pH effects on the NS3 secondary structure upon chemical denaturation.

A) CD spectra of 10 µM NS3hel acquired at pH 7.2 in the absence of Gdn.HCl (solid line), or presence of 2.5 M (dashed line) and 5 M (dotted line) Gdn.HCl. The spectra were the average of three scans after subtracting the buffer baselines. Each spectrum was converted into molar ellipticity using Equation 4 (Material and Methods). B) The ellipticity values at 222 nm (θ222) at each Gdn.HCl concentration (from 0 to 5 M) were used to compare the secondary structure stability of NS3hel at pH 6.4 and 7.2 and to calculate the degree of denaturation using Equation 5 (Material and Methods). Closed (pH 6.4) and open circles (pH 7.2) represent the degree of denaturation at each Gdn.HCl concentration. Spectra were acquired at 25°C in buffer solutions composed of 50 mM MOPS-NaOH (pH 6.4 or 7.2), 200 mM NaCl, 5 mM β-mercaptoethanol and 5% glycerol. The protein concentration was 10 µM.
