
Figure 6. Effects of pH on NS3 binding to ssDNA.
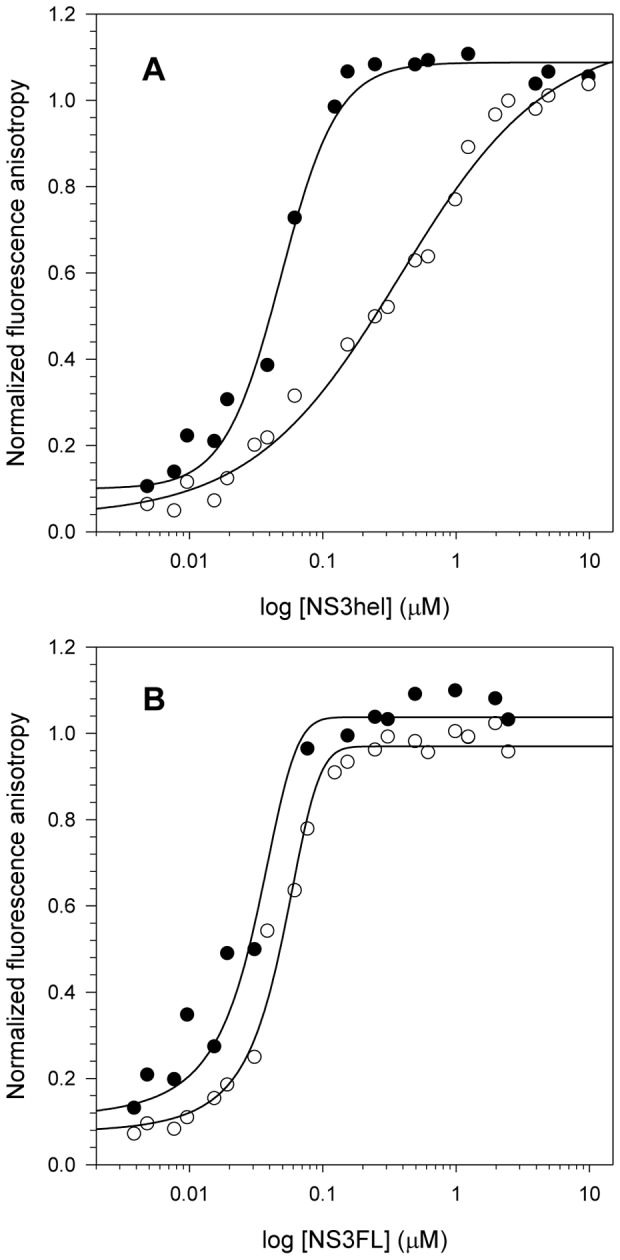
Increasing protein concentrations (from 0 to 10 µM NS3hel and 0 to 5 µM NS3FL) were used to compare NS3hel (A) and NS3FL (B) binding to a fluorescently-labeled ssDNA at pH 6.4 and 7.2 and to calculate the dissociation constants (Kd) between ssDNA and the constructs. Closed (pH 6.4) and open circles (pH 7.2) represent the mean of fluorescence anisotropy obtained in three independent experiments. Data were obtained at 25°C and assay buffers contained 25 mM MOPS-NaOH (pH 6.4 or 7.2), 2 mM MgCl2 and 25 nM of the fluorescently labeled ssDNA.