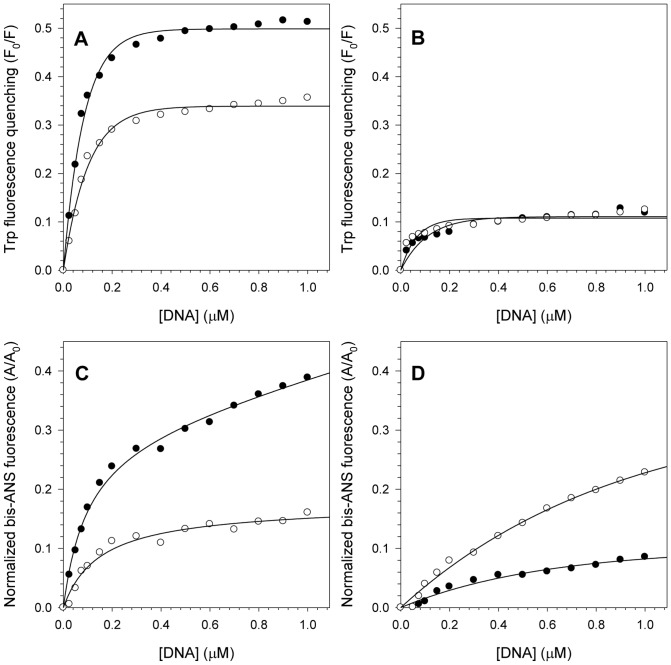
Figure 7. Effects of ssDNA binding on NS3 structure monitored by Trp fluorescence quenching and bis-ANS binding.
Increasing ssDNA concentrations (from 0 to 1 µM) were used to compare the Trp fluorescence quenching of NS3hel and NS3FL (A and B, respectively) and the bis-ANS binding to these proteins (C and D, respectively) at pH 6.4 (closed circles) and 7.2 (open circles). Each point represents the mean of Trp fluorescence quenching or bis-ANS binding obtained in three independent experiments. Spectra were obtained at 25°C and assay buffers contained 25 mM MOPS-NaOH (pH 6.4 or 7.2), 2 mM MgCl2 and 1 µM of purified proteins.

