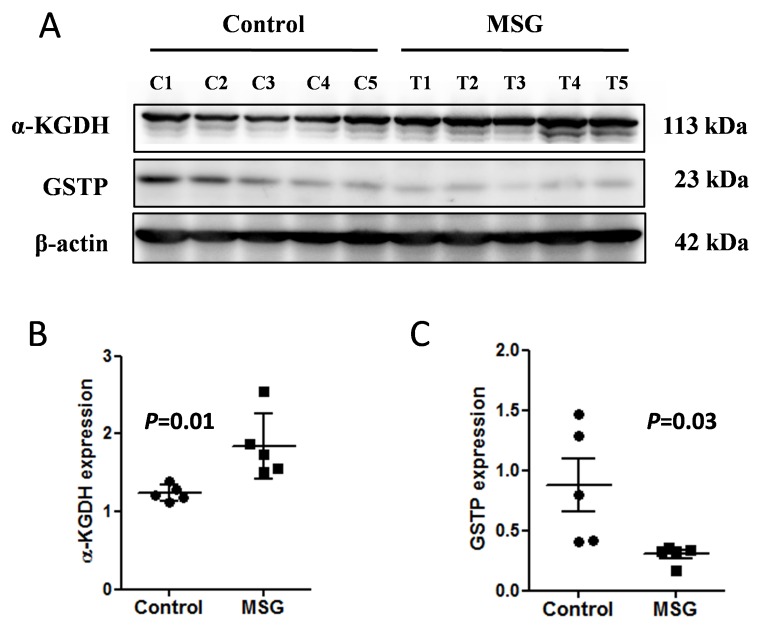
Figure 3. Western blot analysis of α-ketoglutarate dehydrogenase (α-KGDH) and glutathione S-transferase P (GSTP) in the kidney tissues of control and MSG treated groups (A), Quantitative analysis indicated that α-KGDH expression was significantly higher in the kidney of the MSG-treated group than that of control (B), whereas, GSTP expression was found significantly lower than that of control (C).
The blots shown are representative of two independent experiments. C1–C5 and T1–T5 indicate animals in the control and MSG-treated groups, respectively.

