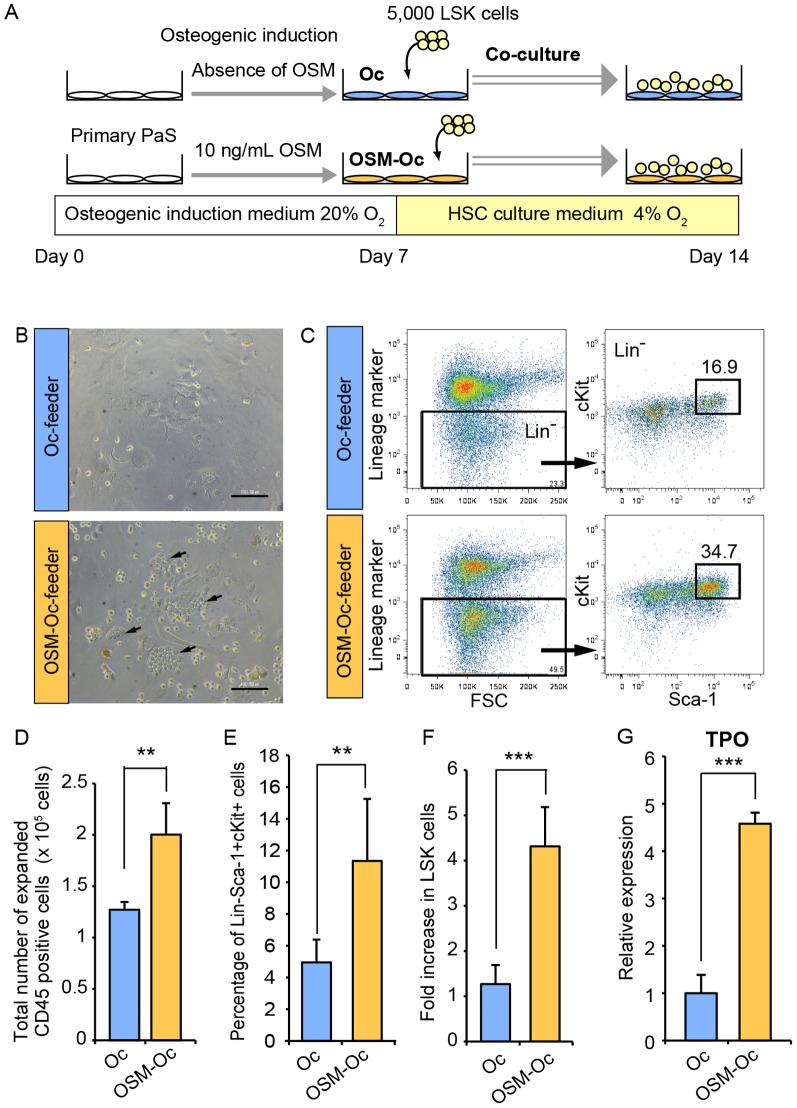
Figure 4. OSM enhances the capacity of PαS-derived osteoblastic cells to support hematopoisis in vitro.
(A) The experimental schedule for the co-culture of LSK cells and the feeder layer. After the osteoblastic differentiation of PαS cells with or without OSM, LSK cells were co-cultured under 4% O2 conditions (balanced by N2). After 7 days of co-culture without OSM, cells were harvested and reanalyzed by FACS. (B) The morphology of LSK cells cultured on Oc-feeder and OSM-Oc-feeder. “Cobblestone”-like clusters (arrows) were observed in the OSM-Oc-feeder. Scale bars indicate 100 µm. (C) FACS analysis of harvested cells after 7 days of co-culture. Representative images and the percentage of the LSK cells in lineage negative CD45+ cells are shown. (D) The total numbers of expanded cells after 7 days of co-culture (n = 5). (E, F) The percentage of the LSK cells in total CD45 positive cells (E) and fold increase of LSK cells relative to input cells (F) after 7 days of co-culture are shown (n = 5). (G) Expression analysis of TPO in the Oc-feeder and OSM-Oc-feeder by real-time RT-PCR (n = 3). Data are presented as means ± S.D. **P<0.01, ***P<0.001.

