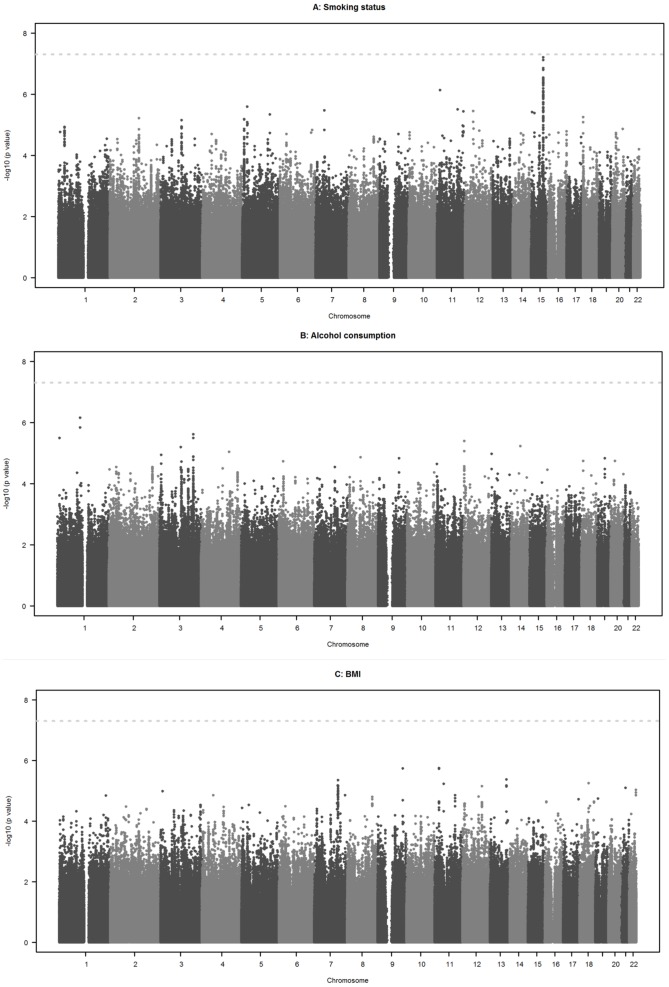
Figure 2. Interaction of gene variants and environmental factors on fibrinogen concentration (in g/L), adjusted for age and sex.
A) Manhattan plot for smoking status. The horizontal axis denotes chromosome and position of each gene variant and the vertical axis gives the negative log10 of the p value for interaction of each gene variant and smoking status on fibrinogen concentration (in g/L), estimated by meta-analyses. The dotted line denotes genome-wide significance (5.0×10⁻⁸). B) Manhattan plot for alcohol consumption. The horizontal axis denotes chromosome and position of each gene variant and the vertical axis gives the negative log10 of the p value for interaction of each gene variant and alcohol consumption on fibrinogen concentration (in g/L), estimated by meta-analyses. The dotted line denotes genome-wide significance (5.0×10⁻⁸). Alcohol consumption was assessed only in 20 studies. C) Manhattan plot for BMI. The horizontal axis denotes chromosome and position of each gene variant and the vertical axis gives the negative log10 of the p value for interaction of each gene variant and BMI on fibrinogen concentration (in g/L), estimated by meta-analyses. The dotted line denotes genome-wide significance (5.0×10⁻⁸).

