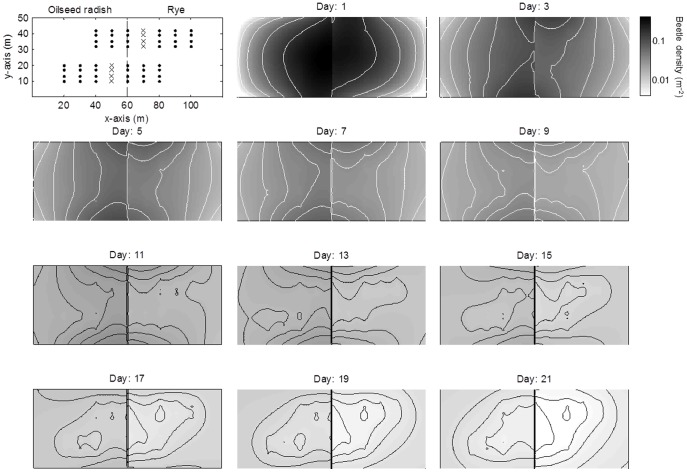
Figure 6. Time evolution of the distribution of Pterostichus melanarius in two adjacent crops simulated with a Fokker-Planck diffusion model (model 1, Table 1) that had a common value of motility for both crops (215 m2 d−1) and preferential movement at the interface equivalent to a beetle on the interface moving to oilseed radish with a probability of 0.60 and moving to rye with a probability of 0.40.
Beetle densities varied between 0.42 m−2 on day 1 to 0.008 m−2 on day 21. Beetles densities in the slow-release margins that surrounded the experimental field were omitted. Crosses and dots in the upper left panel mark the locations at which beetles in the model were released and recaptured, respectively.

