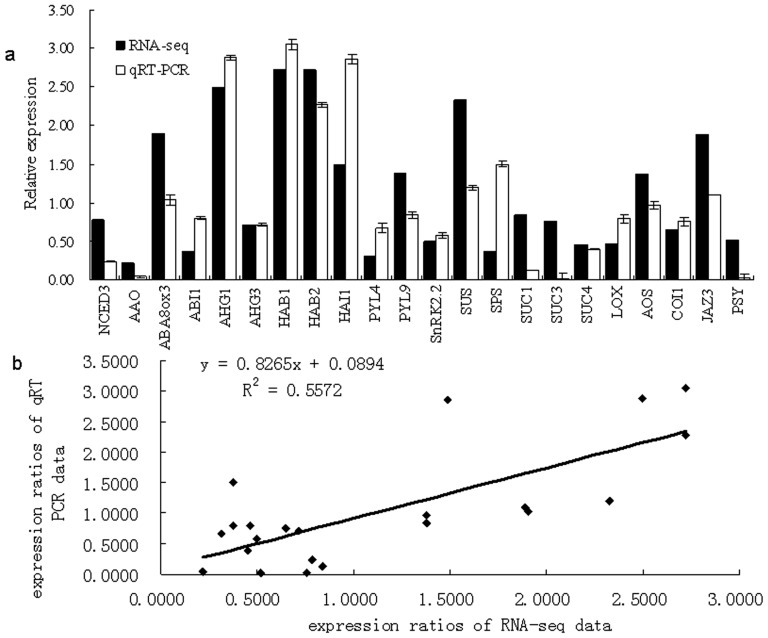
Figure 6. Comparison of gene expression ratios that were obtained by RNA-seq and by quantitative real-time PCR (qRT-PCR): (a) the comparison of the gene expression value gained by RNA-seq and by qRT-PCR; (b) the liner regression analysis between the gene expression ratios obtained by RNA-seq and by qRT-PCR.
The black bars represent RNA-seq data, and the white bars represent the qRT-PCR data. The RNA-seq data were first restituted to 2×. The linear regression [(RNA-seq value) = a (RT-PCR value) + b] analysis indicated a positive relationship between them.

