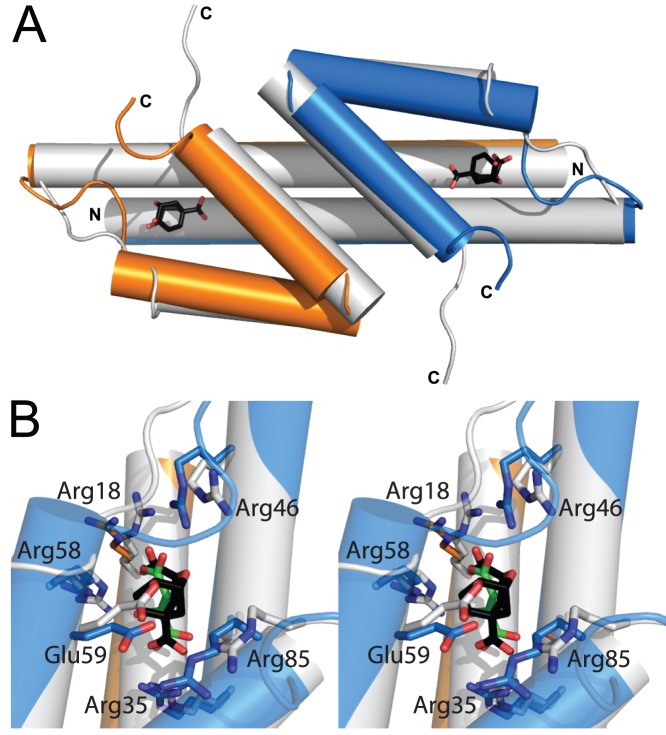
Figure 2. Comparison of free and MtDS-complexed MtCM.
Superimposition in cartoon mode of free MtCM (white, PDB: 2VKL, active site liganded with malate) and MtCM from the complex with MtDS (MtCM subunits in blue/orange, PDB: 2W1A, active site liganded with 7 shown as sticks with black carbons). MtDS is omitted for clarity. (A) Overview with labeled N and C termini. Only the active site ligand of MtCM in PDB: 2W1A, the transition state analog 7, is shown. (B) Wall-eyed stereogram of the superimposed active sites, with both liganded malate (sticks with green carbons) and 7. Side chains of some active site residues, which change location upon complex formation, are shown as sticks [10].

