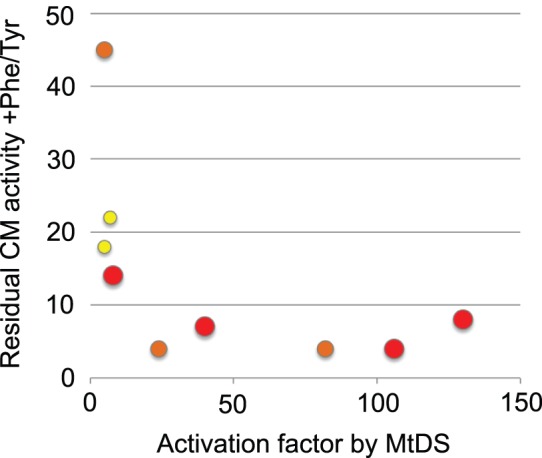
Figure 9. Correlation between MtDS interactions and sensitivity to feedback inhibition of MtCM variants.

The plot shows a graphical correlation of the salient features of the selected MtCM library variants (and the wild type) from Table 1 and Fig. 8. All variants that are activated by MtDS by more than 20 fold also show high sensitivity of the complex to feedback inhibition by Phe and Tyr (i.e. show low residual activity +Phe/Tyr). Conversely, lower sensitivity to feedback inhibition correlates with poor activation by MtDS and with a lower potential to shift the MtDS-band on native PAGE. Circle size and color represent a full (large, red), partial (intermediate, orange), or no shift of the MtDS band (small, yellow).
