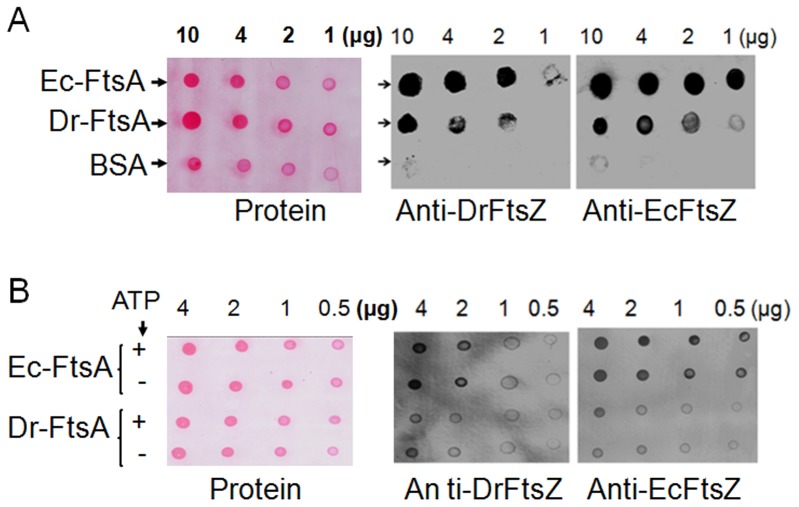
Figure 6. In vitro interaction of FtsZ with FtsA.
Increasing concentration (1–10 µg) of Dr-FtsA and Ec-FtsA were incubated in the absence (A) and presence of ATP (B) for 10 min and blotted on nitrocellulose support (Protein). Blots were incubated separately with 1 µg/ml of purified recombinant Dr-FtsZ and Ec-FtsZ overnight at 4°C as described in methods, washed gently and hybridized with antibodies against Dr-FtsZ (Anti-DrFtsZ) and Ec-FtsZ (Anti-EcFtsZ), respectively. Signals were detected using NBT/BCIP system for alkaline phosphatase. BSA was taken as a control and processed in parallel. Data shown are representatives of the reproducible experiments repeated three times.

