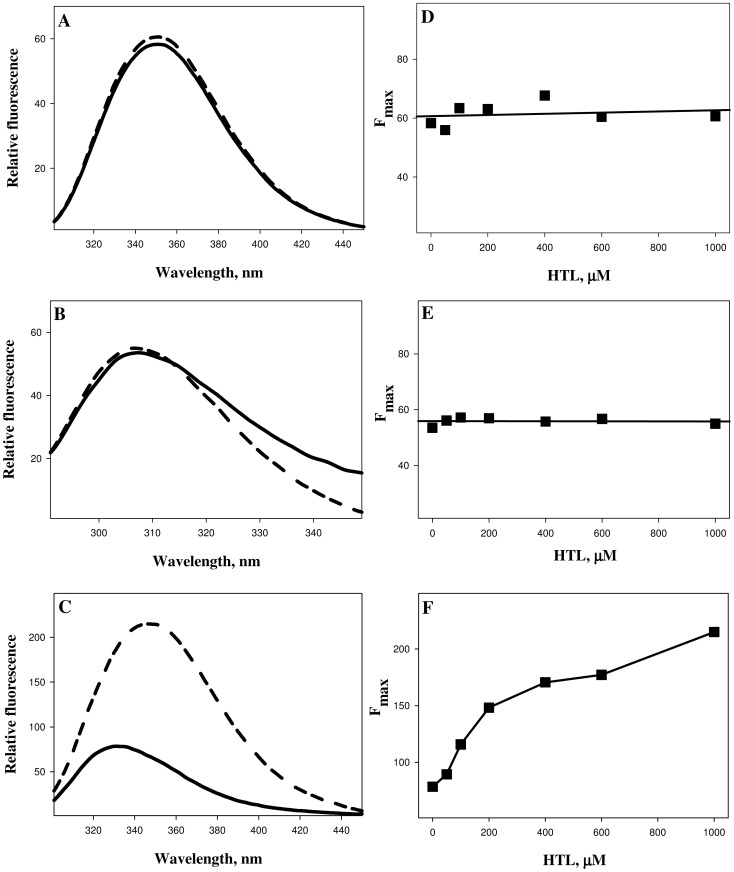
Figure 2. Intrinsic fluorescence spectra (left panel) of lysozyme (A), RNase-A (B) and α-LA (C) modified with HTL.
To maintain clarity, only the representative curves of control unmodified protein (solid lines) and protein modified with 1000 µM HTL (dashed lines) are shown. Plots of the fluorescence maxima (Fmax) as a function of HTL concentrations of lysozyme (D), RNase-A (E) and α-LA (F) are given in the right panel.

