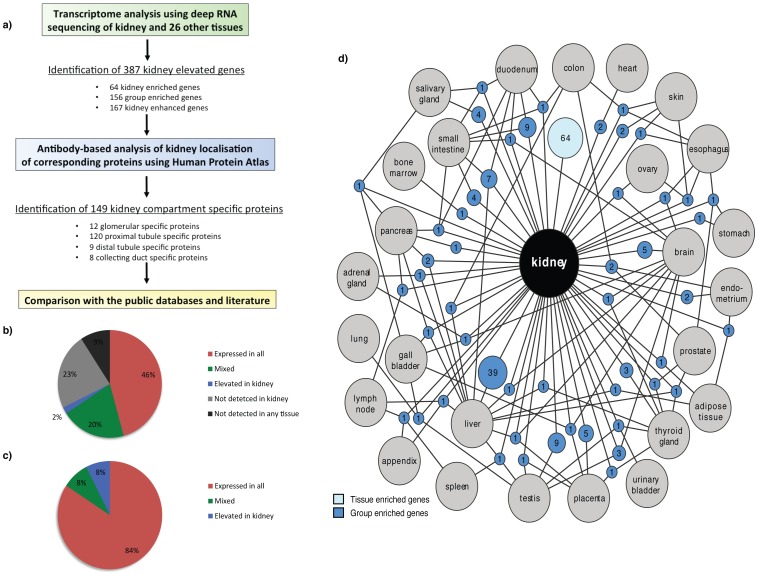
Figure 1. Correlation and classifications of genes expressed in kidney in relation to gene expression in other tissues.
(a) Flow chart for the identification of kidney elevated genes and genes with unique localization to one nephron segment or collecting duct performed in this work. (b) Distribution of kidney expressed genes as the percentages of expressed mRNA molecules, i.e. the sum of all FPKM values for the genes expressed in kidney for each of the categories. (c) The classification of all human 20,050 protein coding genes divided in six different categories based on transcript abundance and number of detected tissues show 68% of human protein coding genes expressed in kidney. Colours in (b)-(c) represent six categories: not detected (grey), highly tissue enriched, moderately tissue enriched or group enriched (blue), tissue enhanced (dark blue), mixed (green), expressed in all low (red), expressed in all (dark red). (d) Network plot of the kidney enriched genes (light blue) and the group-enriched genes shared with ≤3 other tissues (dark blue). Blue circle nodes represent a shared group of expressed genes and are connected to the respective enriched tissues (grey circles). The size of each blue node is related to the square root of the number of genes enriched in a particular combination of tissues.

