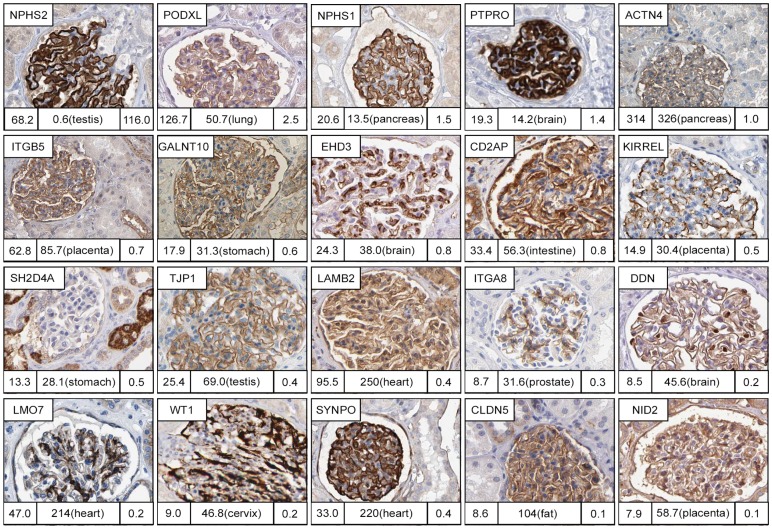
Figure 3. Reverse analysis of proteins previously characterised as glomeruli specific.
4 of 20 glomeruli specific proteins selected based on literature (NPHS2, PODXL, NPHS1 and PTPRO) are found in the group of kidney enriched/enhanced proteins when compared to RNAseq data for the 27 tissues. Furthermore, 6 of the 20 genes do not display a glomeruli-specific localisation within kidney (ITGB5, GALNT10, CD2AP, SH2D4A, LAMB2, CLDN5). Numbers under each IHC image correspond to mean FPKM in kidney (left bottom), Max FPKM in next most highly expressed tissue and the tissue name (middle bottom), and tissue specificity score in kidney (right bottom).

