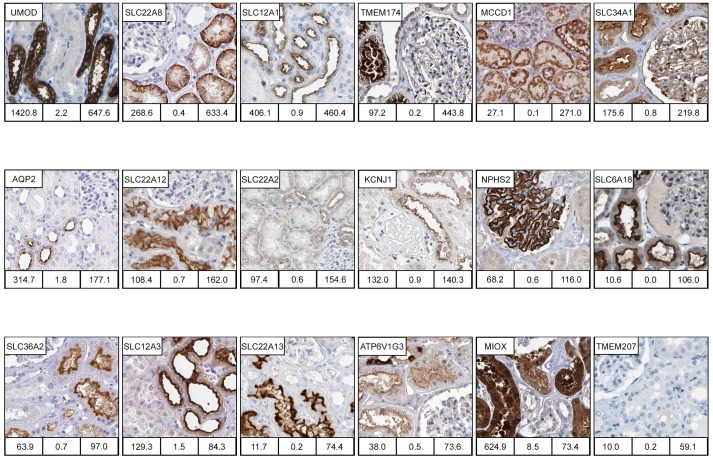
Figure 4. Examples of highly enriched kidney proteins.
Immunohistochemically (IHC) stained images of proteins selectively expressed in different subsets of cells and structures in kidney tissue. IHC images were available for 18 of the 20 highly enriched genes, and for 17 of the 18 genes the expression in kidney were confirmed, here ordered according to tissue specificity score in the figure. When ordered according to nephron segment, these are; glomeruli podocytes (NPHS2), proximal tubule cytoplasm (MIOX) and proximal tubule basolateral membrane (SLC22A8, SLC22A2) and proximal tubule luminal membrane (TMEM174, SLC34A1, SLC22A12, SLC6A18, SLC36A2 and SLC22A13), distal tubule cytoplasm (UMOD) and distal tubule luminal membrane (SLC12A1, KCNJ1, SLC12A3), and collecting duct luminal membrane (AQP2). MCCD1 localises the cytoplasm in cells of all tubular segments cytoplasm. ATP6V1G3 localises to luminal membrane of both proximal and distal tubule luminal membrane and with a strong cytoplasmic staining in intercalated cells in collecting duct. TMEM207 could not be confirmed as expressed in kidney in IHC images available in the Protein Atlas. Numbers under each IHC image correspond to mean FPKM in kidney (left bottom), max FPKM of the second most highly expressed tissue (middle bottom), and to Tissue specificity score (TS) in kidney (right bottom).

