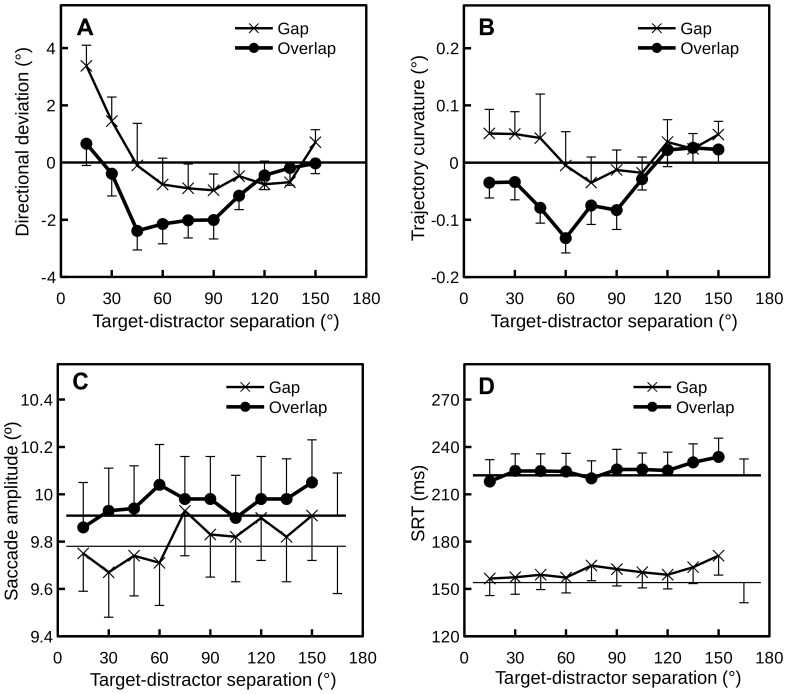
Figure 4. Mean directional deviation (A), trajectory curvature (B), saccade amplitude (C) and SRT (D) for each target-distractor separation in the gap and overlap conditions in Experiment 1.
Error bars denote ±1 SE; for clarity, only one side of the error bars is drawn. In (C) and (D), thick and thin horizontal lines denote distractor-absent trials in the overlap and gap conditions, respectively.

