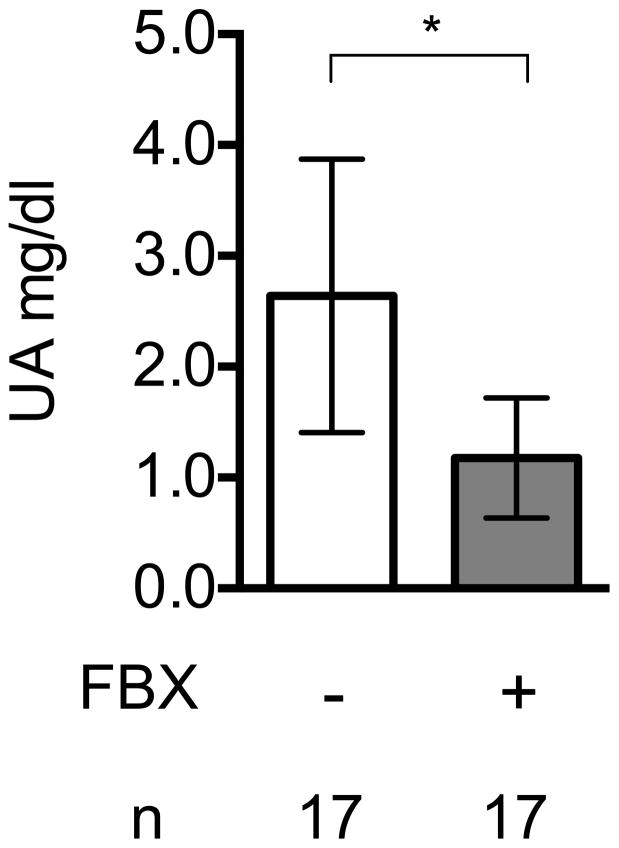
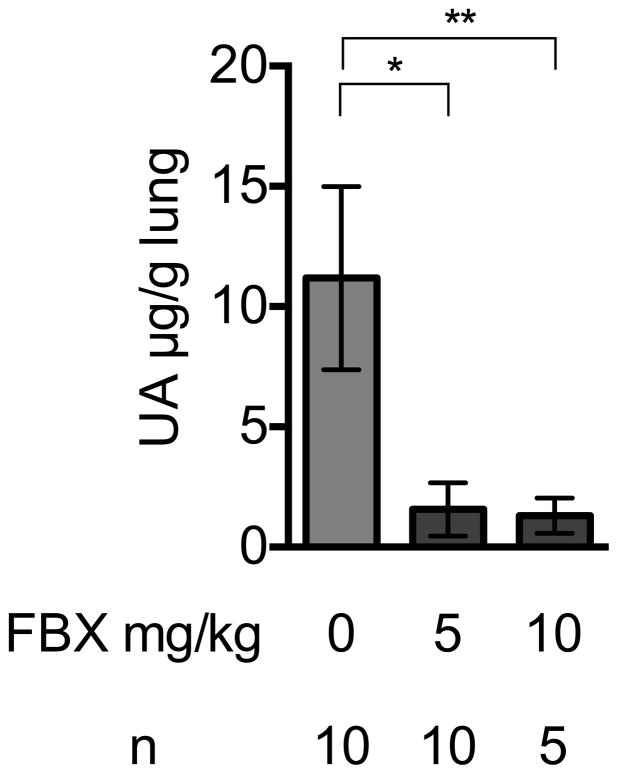
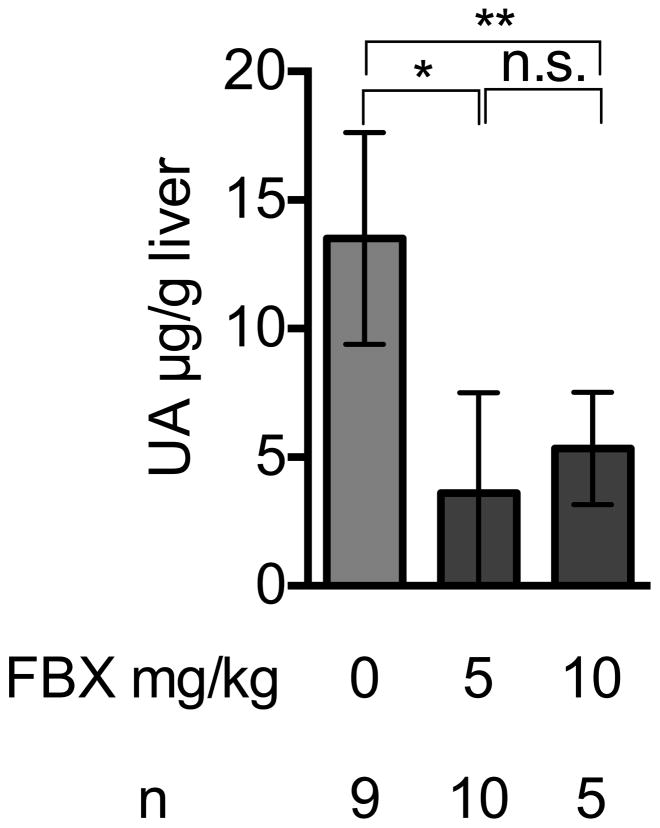
Fig. 1. Febuxostat lowers basic uric acid level in lung and liver.
Fig. 1A
Uric acid lowering effect of Febuxostat
Uric acid was measured in serum of control or Febuxostat (FBX)-treated mice. Means and standard deviations (S.D.) were calculated from the accumulated data of 4 independent experiments. In individual experiments the number of mice per condition was 3–5 for experimental groups and 3–5 in the untreated controls. The bar shows the mean of the data and the limiting bars show the standard deviation. (n = total number of mice from the multiple experiments for each group). * P<0.01 (Mann-Whitney U test)
Fig. 1B
Effect of Febuxostat on Uric acid levels in lung homogenates
Uric acid was measured in the whole left lung of control or, 5 or 10mg/kg Febuxostat (FBX)-treated mice. Means and S.D. were calculated from the accumulated data of 2 independent experiments. In individual experiments the number of mice per condition was 5 for experimental groups and 2–3 in the untreated controls. The bar shows the mean of the data and the limiting bars show the standard deviation. (n = total number of mice from the multiple experiments for each group). *,**P<0.05 (one-way ANOVA)
Fig. 1C
Febuxostat effect on uric acid in liver homogenates
Uric acid was measured in the liver homogenates of control or Febuxostat (FBX)-treated mice Means and S.D. were calculated from the accumulated data of 2 independent experiments. In individual experiments the number of mice per condition was 4–5 for experimental groups and 2–3 in the untreated controls. The bar shows the mean of the data and the limiting bars show the standard deviation. (n = total number of mice from the multiple experiments for each group). *,** P<0.05 (one-way ANOVA)


