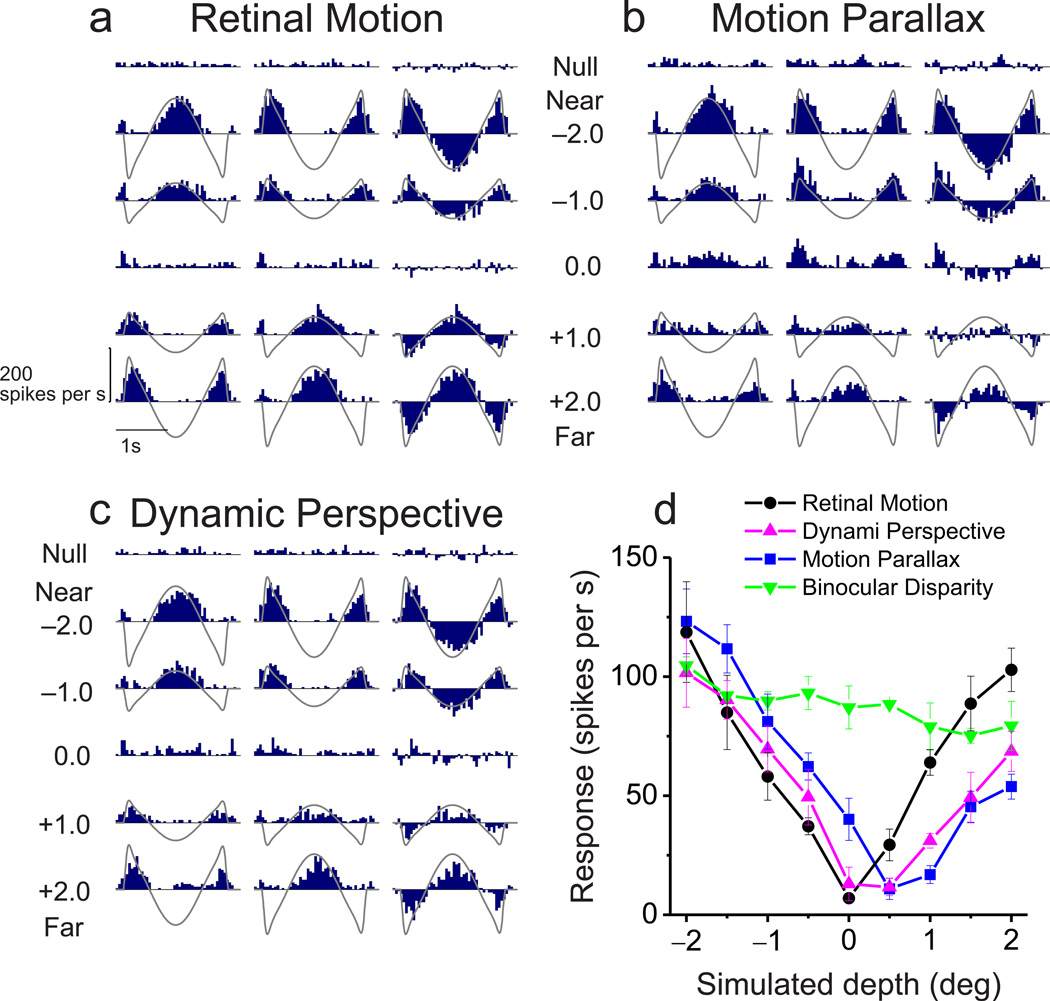
Figure 2. Raw responses and depth tuning curves for an example neuron.
(a–c) Peri-stimulus time histograms (PSTHs) for each experimental condition: Retinal Motion, Motion Parallax, and Dynamic Perspective, respectively. Due to the quasi-sinusoidal trajectory of observer translation, retinal image motion has a phasic temporal profile (gray curves). Rows correspond to different stimulus depths. Left and middle columns indicate data for the two starting phases of motion. The right column shows the difference in response between these two phases. Note that responses to near and far depths are balanced in the Retinal Motion condition, but the neuron responds more to near depths in the Motion Parallax and Dynamic Perspective conditions. (d) For each stimulus condition, depth-tuning curves are shown. Response amplitude is computed as the magnitude of the Fourier transform of the difference response at 0.5Hz. Tuning in the Retinal Motion condition is symmetrical around zero depth (black, DSDI = −0.09), whereas tuning curves show a clear preference for near depths in the Motion Parallax (blue, DSDI = −0.80), Dynamic Perspective (magenta, DSDI = −0.67) and Binocular Disparity conditions (green, DSDI = −0.56). Error bars represent s.e.m.

