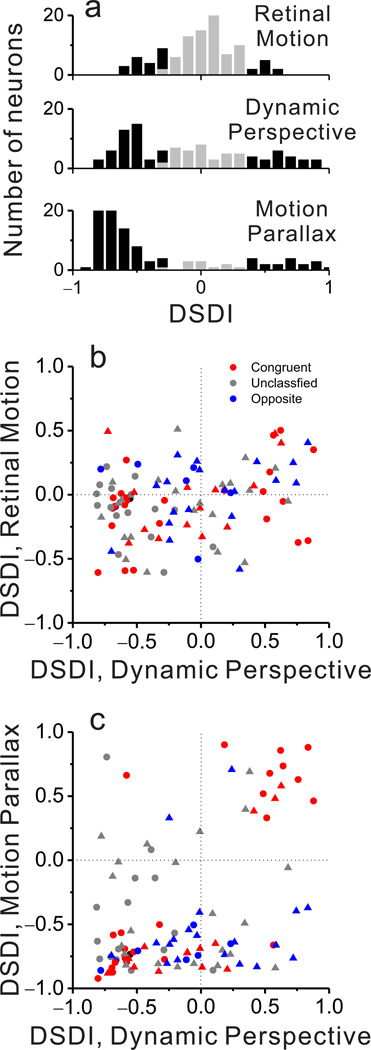
Figure 4. Population summary of depth-sign selectivity.
(a) Histograms of DSDI values for each stimulus condition: Retinal Motion (top), Dynamic Perspective (middle), and Motion Parallax (bottom). Black bars represent DSDI values that are significantly different from zero, whereas gray bars are not significant. (b) DSDI values in the Retinal Motion and Dynamic Perspective conditions are weakly correlated (ρ = 0.25, P = 0.01, Spearman rank correlation). Colors represent congruent (red), opposite (blue), and unclassified (gray) neurons. Circles and triangles denote data from monkeys M1 and M2, respectively. (c) DSDI values for the Motion Parallax and Dynamic Perspective conditions are highly correlated for congruent cells (red, n = 38, ρ = 0.70, P = 2.6 × 10⁻⁶), but not for opposite or unclassified cells. Format as in b.

