
Figure 1.
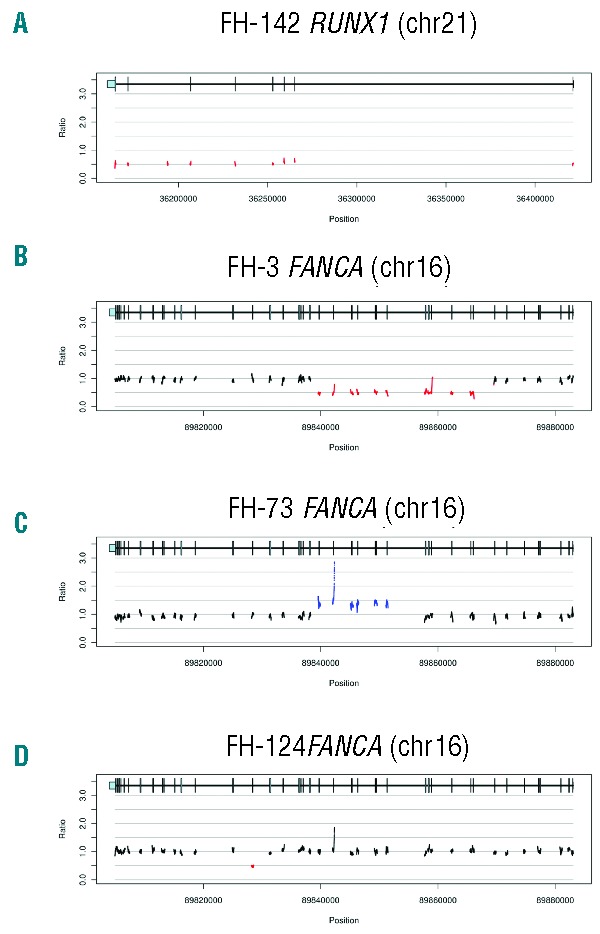
Detection of genomic copy number variants. Ratios of sample to median corrected depth of coverage within a flow cell lane are plotted across targeted genomic regions of the indicated gene. Diploid bases are shown in black. Deletions and duplications are shown in red and blue, respectively. Genomic positions of exons (vertical bars) and untranslated regions (light blue rectangles) are shown above ratio plots. (A) Whole gene deletion of RUNX1. No diploid bases were present in this region. (B) Deletion of FANCA exons 9–22. (C) Amplification of FANCA exons 15–22. (D) Deletion of FANCA exon 29.