
Figure 3.
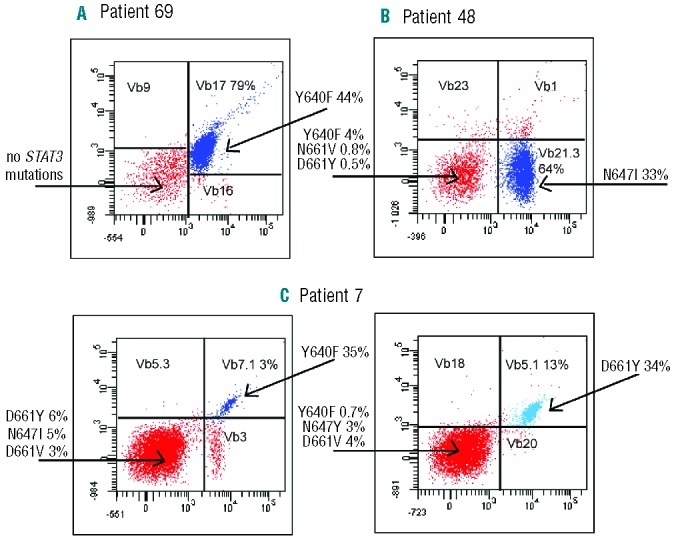
The flow cytometry Vbeta analysis and STAT3-sequencing results of flow cytometry-sorted lymphocyte fractions from three representative T-LGL leukemia patients. The monoclonal Vbeta antibodies were conjugated with either FITC (x-axis), PE (y-axis), or both PE and FITC (double-positive population), and the Vbeta populations analyzed are marked in each dotplot with the percentage of the clone in CD8+ cells. STAT3 mutations and their VAF are indicated with arrows. (A) The results of patient 69 after 1.5 years after cyclosporine treatment. (B) STAT3 results of patient 48 with four different STAT3 mutations. (C) Patient 7 (Figure 1) had two CD8+ expansions at baseline, Vb7.1+ 10% and Vb5.1 11% (data not shown), and 4 years later during methotrexate treatment the expansions were 3% and 13%, respectively, both harboring STAT3 mutations. This patient also had two minor STAT3 mutations in Vbeta-negative CD8+ cells. FITC: fluorescein isothiocyanate; PE: phycoerythrin; VAF: variant allele frequency.