
Figure 3.
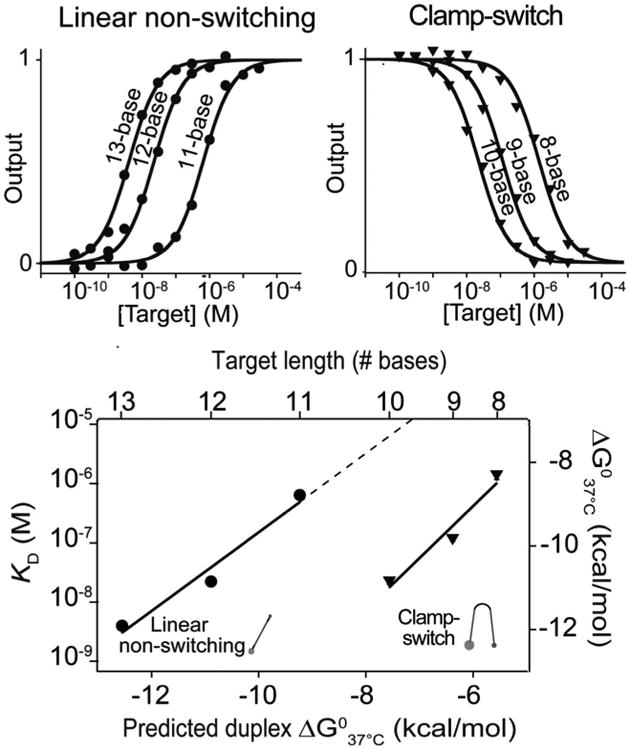
The affinity of the clamp-switch (top, right) is greater than that of the linear non-switching probe (top, left), enough so that a target must be ∼20% longer to bind the later as tightly. Bottom: Shown are the experimentally derived affinities (and the equivalent free energies) of a clamp-switch and a linear non-switching probe using the same Watson-Crick recognition element versus target length (and the nearest-neighbor model predicted binding energy). 37-39 The binding curves were obtained by adding increasing concentration of perfectly matched targets of different length to a 2 nM concentration of clamp-switch (top, right) or linear non-switching (top, left) probe in 100 mM Tris buffer, 10 mM MgCl2, pH 7.0 at 37°C.