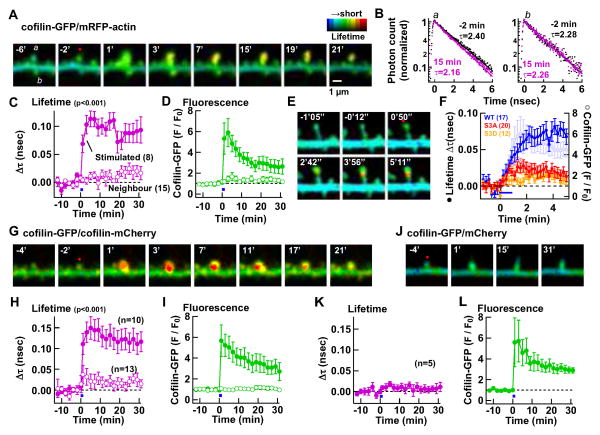
Fig. 5. Cofilin stably interacts with F-actin at a high stoichiometric ratio.
(A–F) Interaction between cofilin and actin was monitored by FRET-FLIM between cofilin-GFP and mRFP-actin. (A) Representative time-lapse FLIM images. sLTP was induced in spine a (red dot) between 0–1 min. (B) Fluorescence lifetime (τ) of the stimulated spine a (left) and an unstimulated spine b (right) before (black) and 15 min after sLTP induction (pink). (C–D) Time course of averaged changes in lifetime (C) and amount of cofilin-GFP (D) in stimulated and neighboring spines (mean ± SEM). Number of spines in parenthesis. (E) Faster time course images where only one optical section was monitored. (F) Summary of data similar to E, showing time course of changes in lifetime (filled circles) and amount of cofilin-GFP (open circles) for WT-cofilin, S3A and S3D cofilin mutants.
(G–I) A similar experiment to identify the proximity between cofilin molecules by detecting FRET-FLIM between cofilin-GFP and cofilin-mCherry.
(J–L) A negative control experiment with cofilin-GFP and free mCherry. See also Fig. S4.

