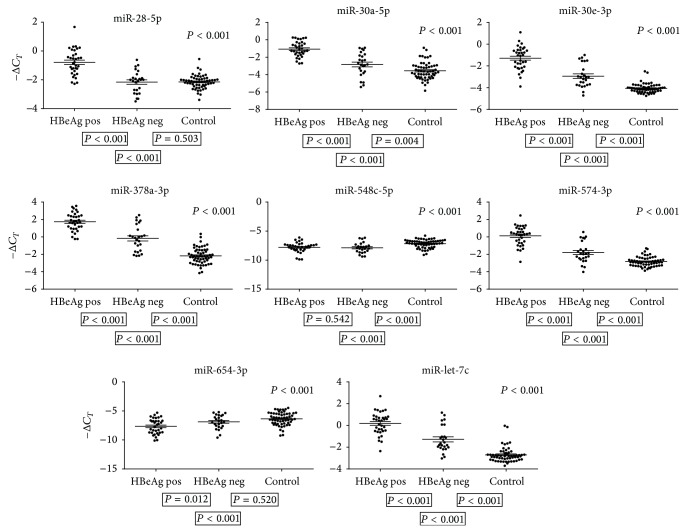
Figure 1.
MicroRNA plasma levels in HBeAg-positive, HBeAg-negative, and healthy children. qRT-PCR-data on 34 HBeAg-positive, 25 HBeAg-negative, and 57 healthy control children. The P values shown above the individual figures are results of statistical analyses on HBeAg-positive, HBeAg-negative, and healthy children, and P values shown below left are results on HBeAg-positive versus HBeAg-negative, below centred HBeAg-positive versus healthy controls, and below right HBeAg-negative versus healthy controls. The bars represent geometric means −ΔC T ± SEM. Due to multiple testing only P < 0.0028 was considered significant.

