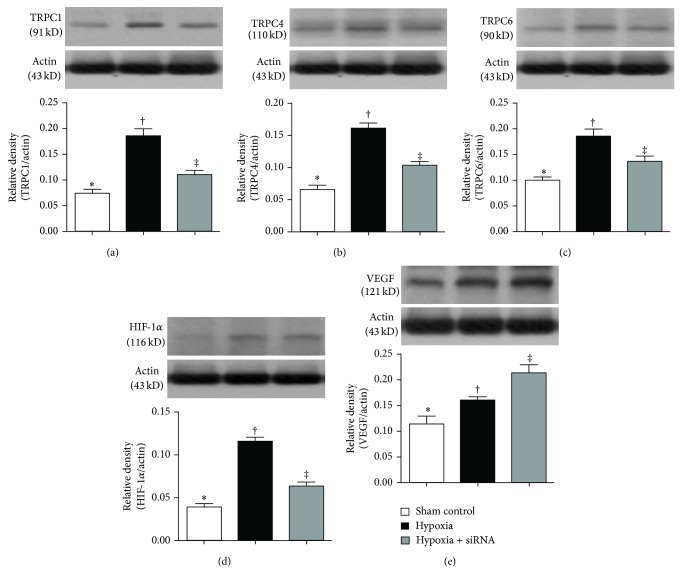
Figure 7.
Protein expressions of TRPCs, HIF-1α, and VEGF of lung parenchyma by day 28 after hypoxia-induced pulmonary arterial hypertension (PAH) (n = 10). (a) Protein expression of TRPC1, ∗ versus other groups with different symbols (∗, †, ‡), P < 0.001. (b) Protein expression of TRPC4, ∗ versus other groups with different symbols (∗, †, ‡), P < 0.01. (c) Protein expression of TRPC6, ∗ versus other groups with different symbols (∗, †, ‡), P < 0.01. (d) Protein expression of HIF-1α, ∗ versus other groups with different symbols (∗, †, ‡), P < 0.001. (e) Protein expression of vascular endothelial growth factor (VEGF), ∗ versus other groups with different symbols (∗, †, ‡), P < 0.01. Statistical analysis in ((a) to (e)) using one-way ANOVA, followed by Bonferroni multiple comparison post hoc test. Symbols (∗, †, ‡) indicate significance (at 0.05 level).

