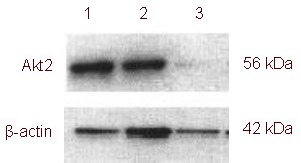
Figure 4.

Akt2 expression in U251 cells (western blot).
Glioma cells in 1: negative control group; 2: blank control group; 3: transfection group. The expression of Akt2 in the transfection group was significantly lower than in the other groups.

Akt2 expression in U251 cells (western blot).
Glioma cells in 1: negative control group; 2: blank control group; 3: transfection group. The expression of Akt2 in the transfection group was significantly lower than in the other groups.