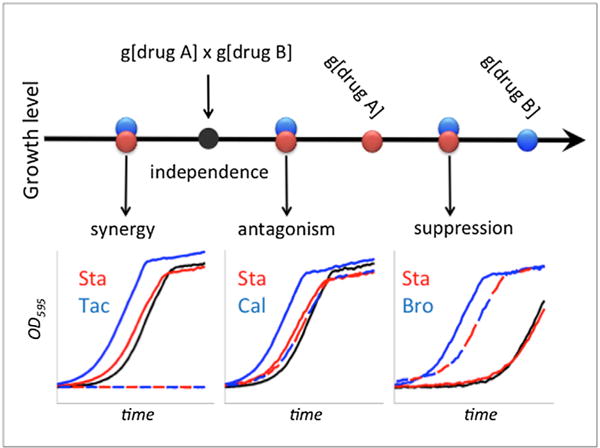
Figure 1. Types of Interactions between two Drugs.

Certain concentrations of drug A and drug B allow growth levels g[drug A] and g[drug B], respectively. These drugs are considered independent under the Bliss independence model if their combined effect is the multiplication of the effects of individual drugs, shown as a black filled circle (g[drug A] × g[drug B]). Overlapping blue and red circles represent three possible regions under which the observed growth may fall, which correspond to three types of drug interactions. Synergy or antagonism occurs when the growth rate under drug combination is smaller or larger than independence, respectively. Suppression is an extreme form of antagonism, where the growth rate under drug combination is higher than the growth rate under [drug A]. In this case, drug B is defined to suppress drug A. Examples for each interaction type are shown as growth curves under single drugs and combinations: synergistic interaction of 0.72 μg/ml Staurosporine with 16 μg/ml Tacrolimus, antagonistic interaction of 0.72 μg/ml Staurosporine with 0.6 μg/ml Calyculin A, and suppressive interaction with 70 μg/ml Bromopyruvate suppressing 1.26 μg/ml Staurosporine. For growth curve insets: drug A, drug B, drug A+B observed, and drug A+B expected growth are depicted in red, blue, dashed blue/red, and black, respectively.
