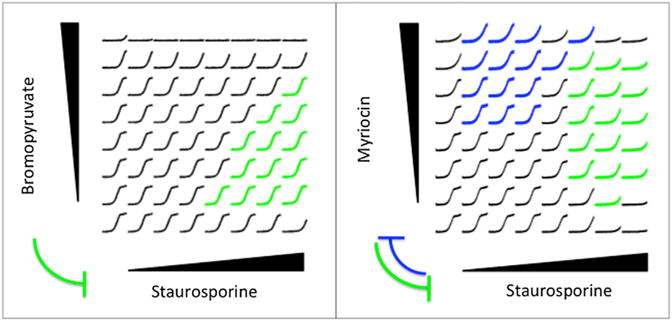
Figure 2. Assessing Suppression and Reciprocal Suppression.

S. cerevisiae cells were grown in an 8 × 8 grid of drug combinations, where the concentration of one drug was linearly increased in each axis. The maximum dose of each drug was chosen close to its MIC. For each drug concentration combination, growth measurements (y axis) for 24 hr (x axis) are depicted. The growth curves corresponding to drug combinations in which the horizontal drug suppresses the vertical drug are given in blue, and the opposite direction of suppression are given in green. Here, we show two broadly supported suppression examples we have found among 175 drug pairs tested, where breadth is defined as the number of combinations in which the suppression phenotype was observed. Suppressive edges learned from data are shown between drug names, where the edge width represents the breadth of suppression.
