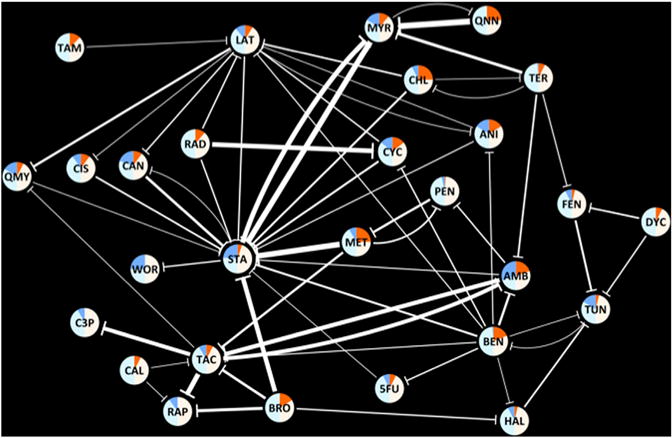
Figure 3. A Network of 61 Suppressive Drug-Drug Interactions.

Nodes represent drugs, and edges represent suppressive interactions. The width of an edge represents the breadth of suppression. The nodes are colored according to the suppression behavior of each drug. Bright blue and orange areas correspond to the frequency of “suppressed” and “suppressing” edges for a drug among all interactions against which it was tested. Similarly, light blue and white areas correspond to the frequency of “not suppressed” and “not suppressing” edges for a drug among all interactions against which it was tested. The three-letter abbreviations for each drug are given in Table 1.
