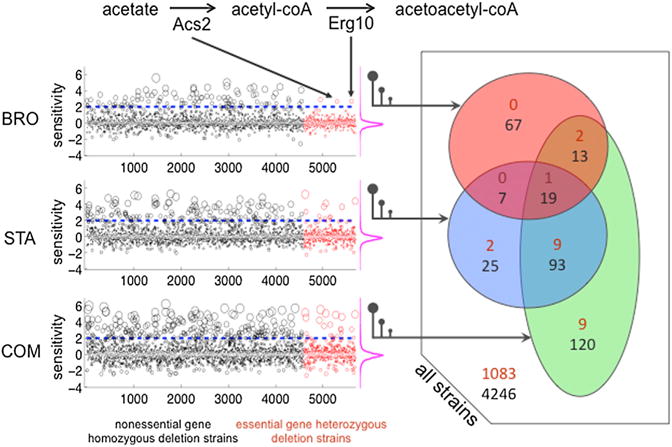
Figure 5. Genome-wide Sensitivity Assessment for Yeast Deletion Strains against Bromopyruvate (BroIC20), Staurosporine (StaIC20), and Their Combination (COMIC20).

In the left panel, sensitivity scores for 4,960 strains, in which both copies of a non-essential gene have been deleted, are shown as black circles (HOP). Sensitivity scores for 1,106 strains, in which one copy of an essential gene has been deleted, are shown as red circles (HIP). For visibility, the sizes of the circles are proportional to the absolute value of the sensitivity scores. In each experiment, strains are ordered by the alphabetical order of the systematic name of the deleted gene(s). On the right of each experiment, the distribution of the sensitivity scores are shown by magenta frequency distributions, indicating that a large majority of deletion strains do not show a growth change. The right panel is a Venn diagram representation of the sensitive strains. Black and red numbers correspond to homozygous or heterozygous deletion strains, respectively.
