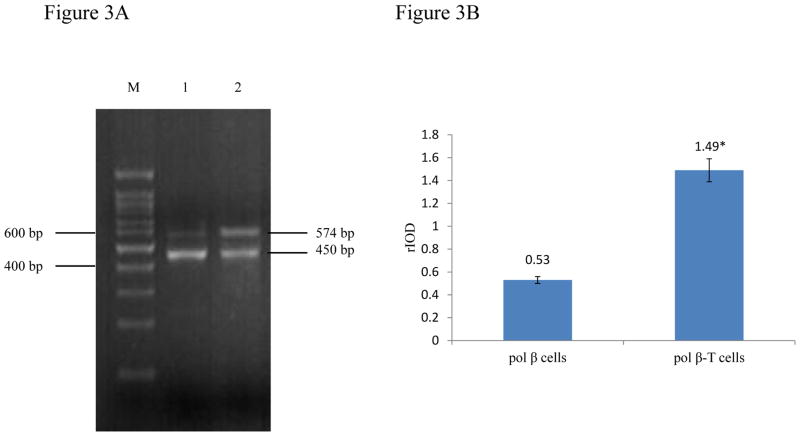
Figure 3. Pol β mRNA level in pol β cells and pol β-T cells.
M: 100 bp DNA ladder marker; Lane1: pol β cells; Lane2: pol β-T cells.
Quantification of the bands intensity of PCR products was analyzed by Image J. Integral optical density value (IOV) = average optical density value of bands × area of bands. Relative optical density value (rIOV) = IOVpol β/IOVG3PDH.

