
FIGURE 1.
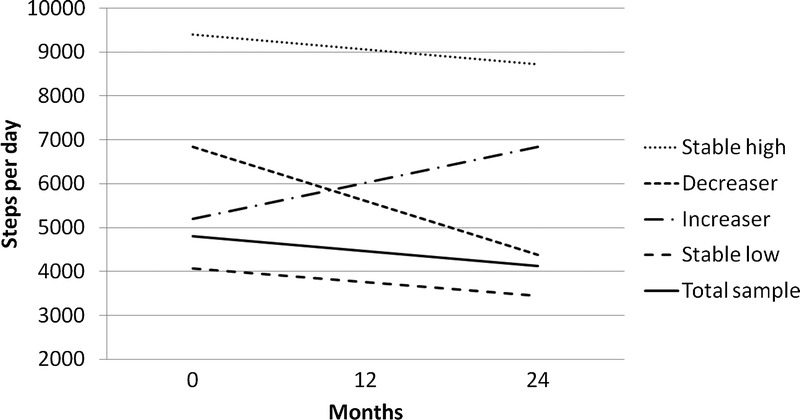
Baseline level and change in number of steps per day in the whole sample and in each of the four groups.
Official websites use .gov
A
.gov website belongs to an official
government organization in the United States.
Secure .gov websites use HTTPS
A lock (
) or https:// means you've safely
connected to the .gov website. Share sensitive
information only on official, secure websites.
Baseline level and change in number of steps per day in the whole sample and in each of the four groups.