
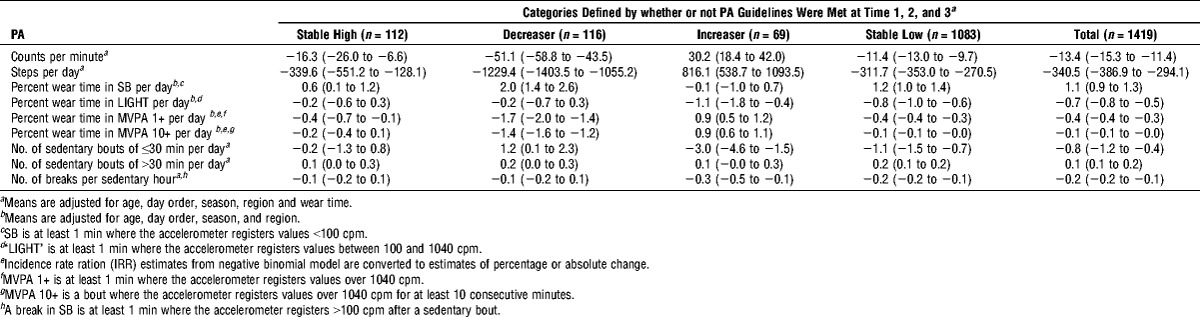
TABLE 3.
Mean (95% CI) annual change in PA according to trajectories of change in PA over three time points (n = 1419).
Official websites use .gov
A
.gov website belongs to an official
government organization in the United States.
Secure .gov websites use HTTPS
A lock (
) or https:// means you've safely
connected to the .gov website. Share sensitive
information only on official, secure websites.
Mean (95% CI) annual change in PA according to trajectories of change in PA over three time points (n = 1419).