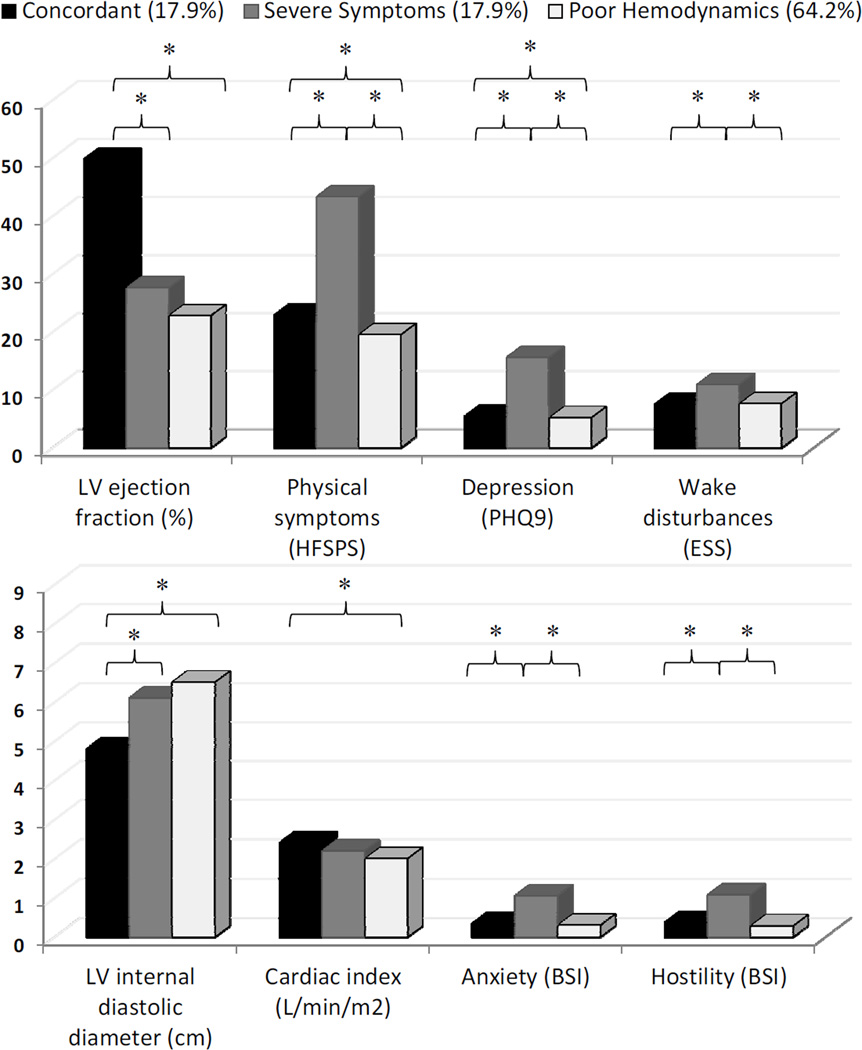
Figure 1.
Bar graphs present significant differences in four hemodynamic values and four symptom measures among the three symptom-hemodynamic profiles. All measures were significantly different across the three groups based on overall -tests with p-values <0.0001.
* = statistically significant between-group tests with p<0.01 corrected for multiple comparisons.
Abbreviations: BSI = Brief Symptom Inventory, ESS = Epworth Sleepiness Scale, HFSPS = Heart Failure Somatic Perception Scale, LV left ventricle, PHQ9 = Patient Health Questionnaire.

