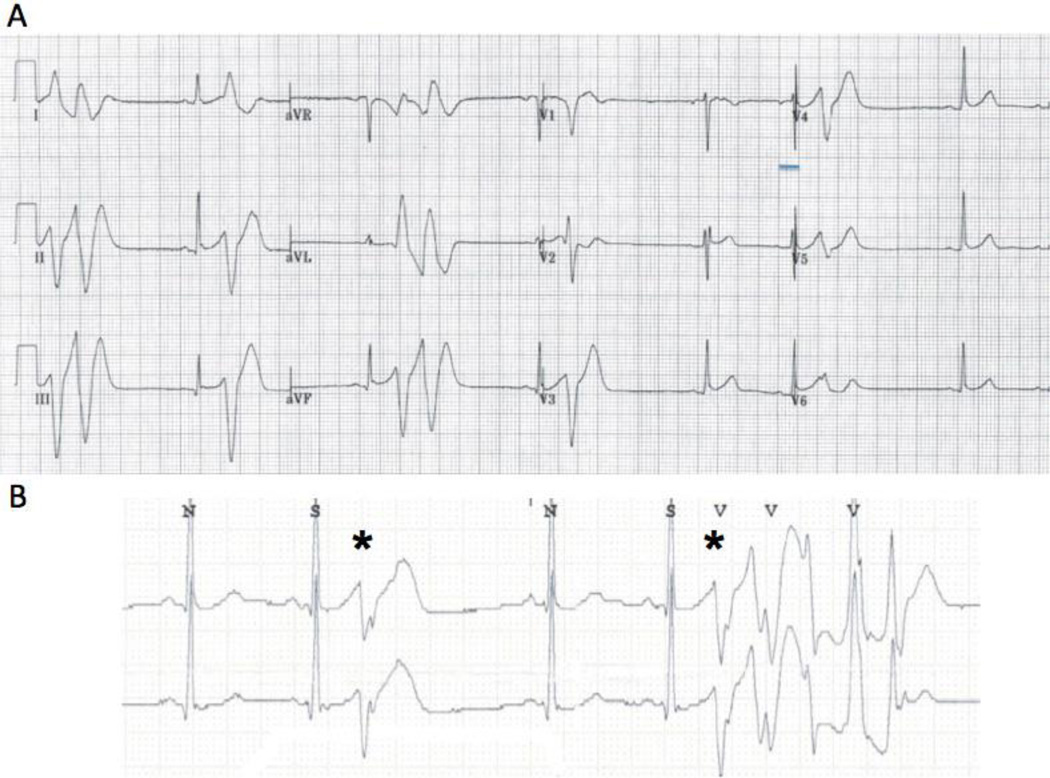
Figure 2.
A: Baseline 12-lead ECG of proband upon presentation with syncope revealing frequent PVCs and couplets. The QTc interval is normal and there is no type I Brugada pattern. Mild early repolarization (≤ 0.1 mV) is seen in leads II, III, aVF and V2–V4. The left bundle branch block, left superior axis morphology PVCs are short-coupled with a coupling interval of 220–260 ms. B: Telemetry strip revealing frequent PVCs with salvos of nonsustained PMVT. The PVCs (*) have an unifocal morphology with a short coupling interval of 240 ms.

