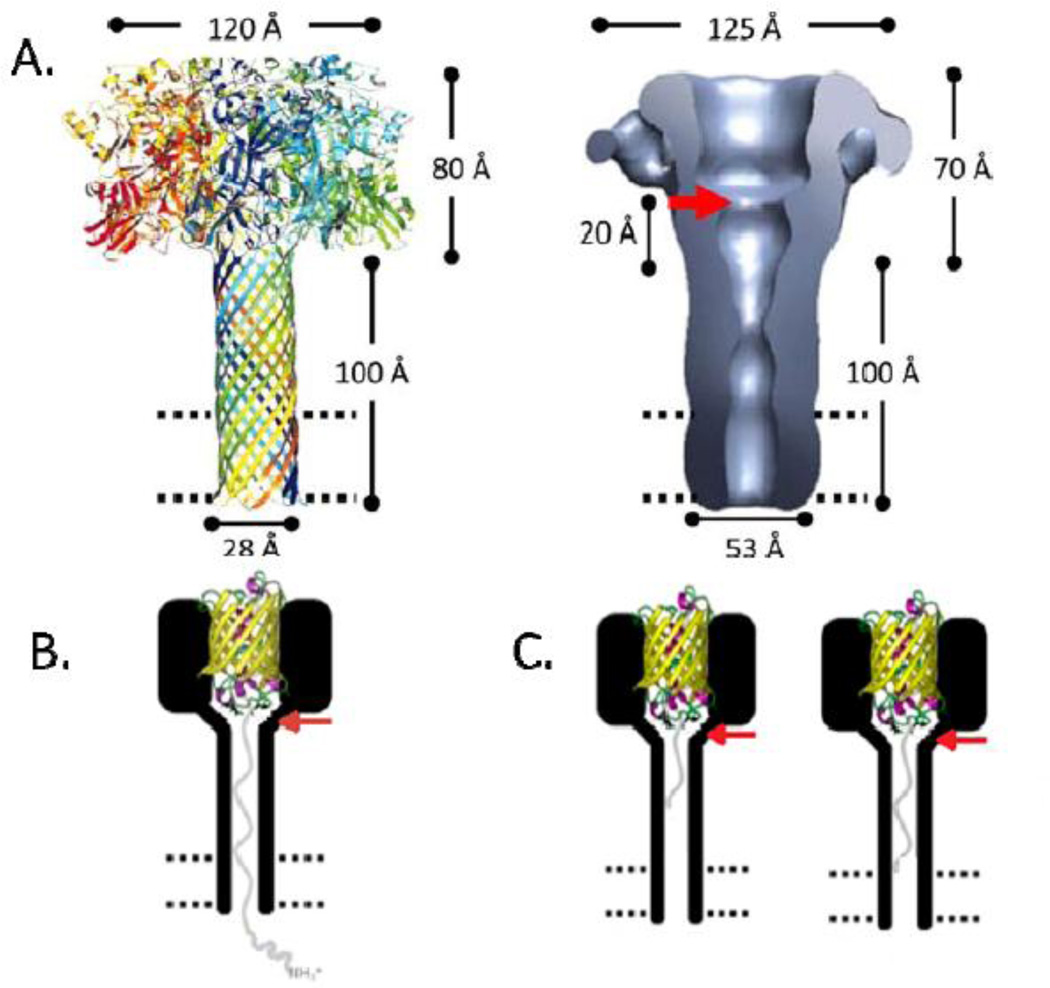
Figure 1.
A14Left: Model of (PA63)76Right: Structure of (PA63)7, determined by negative-stain electron microscopy (~25 Åring; resolution)7. The red arrow denotes the presumed position of the ϕ-clamp; the 20 Åring; bar represents the distance from the ϕ-clamp to the presumed beginning of the stem; the dashed parallel lines represent the lipid bilayer. B. LFN-YFP trapped in (PA63F427A)7 at +50 mV. YFP is represented as a yellow β-barrel; LFN is represented as a grey line; the bilayer is represented as parallel dashed lines. The red arrow indicates the position at which the phenylalanine residues of the ϕ-clamp were mutated to alanine residues (adapted from reference 14). C. Truncated versions of LFN-YFP trapped in (PA63F427A)7 at +50 mV. YFP is represented as a yellow β-barrel; LFN is represented as a grey line; the bilayer is represented as parallel dashed lines. The red arrow indicates the position at which the phenylalanine residues of the ϕ-clamp were mutated to alanine residues (adapted from reference 14).

