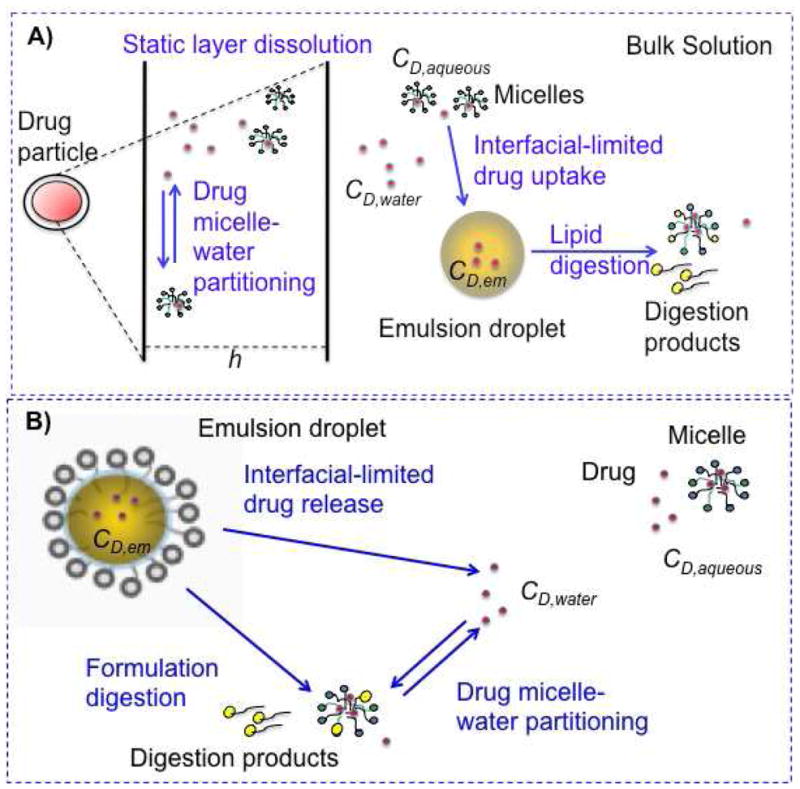
Figure 1.

Schematic representation of two lipid systems studied: A) solid drug dosed with food-associated lipid, B) drug dosed in a lipid-based drug delivery system. Processes relevant to each system appear in blue text. CD,water: free drug concentration, CD,aqueous: free and micelle-associated drug concentration, CD,em: drug concentration in food-associated oil and formulation emulsions, h: static layer around the dissolving drug particles.
