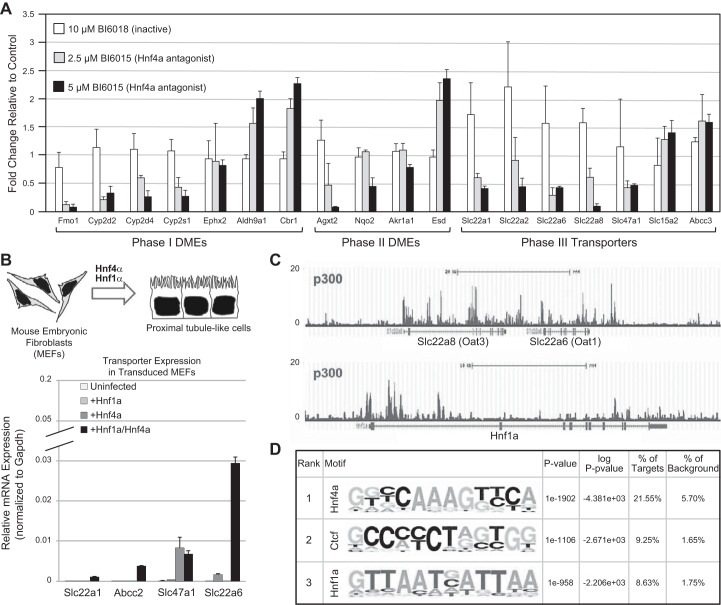
FIGURE 7.
Hnf4α and Hnf1α, regulate drug transporter expression in the developing kidney. A: bar graph demonstrating the changes in the expression of phase I and phase II DMEs, as well as phase III transporters in whole embryonic rat kidneys cultured in the presence of a small molecule antagonist of Hnf4α (120). B, top: viral transduction of mouse embryonic fibroblasts (MEFs) with both Hnf1α and Hnf4α leads to the formation of cells with a proximal tubule-like character. B, bottom: qPCR analysis of MEFs virally transduced with Hnf1α, Hnf4α, or both revealed highest expression of transporter genes when both Hnf1α and Hnf4α are present. C: screenshots of p300 ChIP-seq in adult kidney cortex. P300 binding sites are highly enriched in Oat1 and Oat3, as well as in in the Hnf1α locus. D: two of the most highly enriched transcription factor binding motifs were Hnf4α and Hnf1α. [Modified from Martovetsky et al. (149), with permission from ASPET.]

