
Fig. 2.
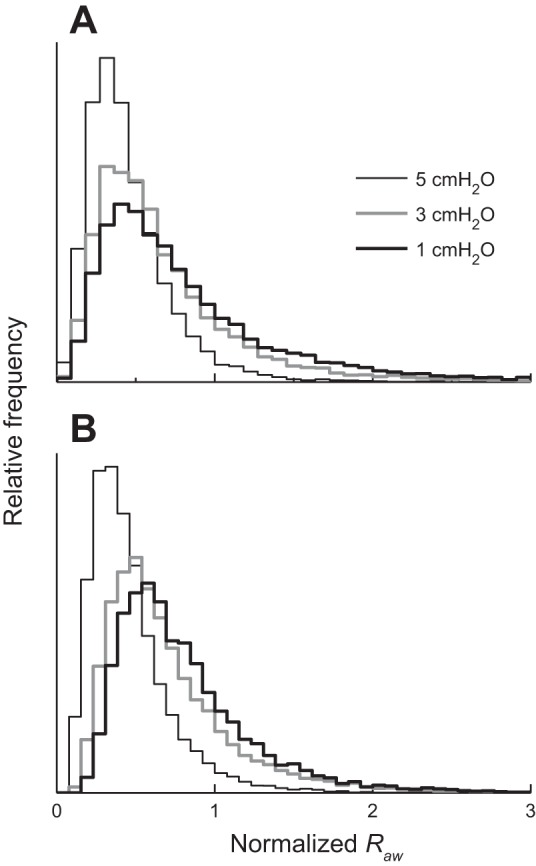
A: histograms of fractional increase in Raw obtained with 3 different values of Ptp while k was drawn randomly from a Gaussian distribution with kmean = 0.73 and kSD = 0.04. B: corresponding histograms obtained with 3 different values of Ptp while α was drawn randomly from a Gaussian distribution with mean = 0.08 and standard deviation = 0.03. Horizontal axis has been transformed from Ptp to body mass index (BMI) using a published relationship between BMI and reduction in functional residual capacity (FRC), as described in the text.