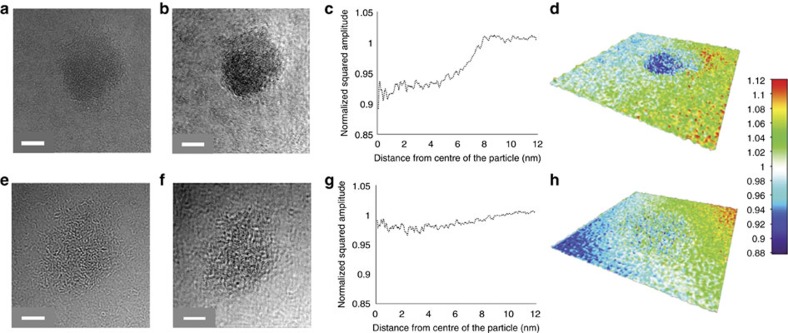
Figure 5. Microscopy analysis of stereocomplex and amporphous spherical micelles.
(a–d) A stereocomplex spherical micelle (obtained from the mixture of homochiral cylinders 3 and 4) and (e–h) an amorphous spherical micelle (obtained from the self-assembly of 1). (a) Near focus aberration-corrected microscope image and (b) EWR-squared amplitude image of a stereocomplex sphere; (e) Near focus aberration-corrected microscope image and (f) EWR-squared amplitude image of an amorphous sphere. All of the images were obtained on graphene oxide supports. The increased density of the stereocomplex sphere relative to the amorphous sphere can be seen in the stronger contrast in the squared amplitude image, this is shown quantitatively in panels c and g (for the stereocomplex micelle and amorphous micelle, respectively), which plots the radially averaged profile of the squared amplitude from the middle of each sphere to the GO support. Panels d and h show the surface plots of the EWR-squared amplitude images demonstrate the higher density of the stereocomplex micelle. Scale bars=5 nm.

