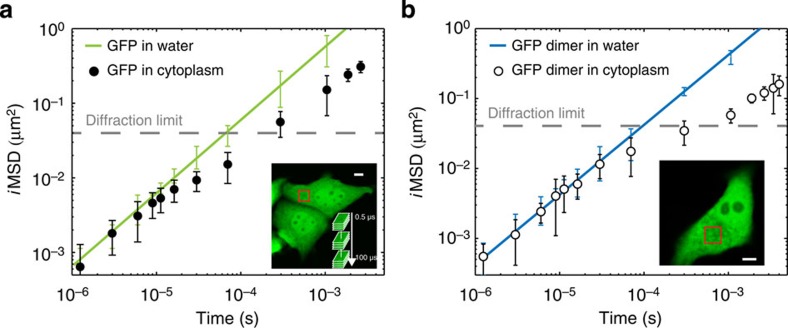
Figure 3. iMSD analysis of GFP diffusing in the cell cytoplasm.
(a) GFP is transiently transfected into living CHO cells and analysed under physiological conditions. Arbitrary micrometre-sized areas in the cell cytoplasm are imaged sequentially at tunable timescales (inset). The iMSD values at the different timescales in the cytoplasm are reported in a double-logarithmic representation, as average of N=3 experiments, n=24 cells (black dots) and compared with the iMSD values obtained in solution (dashed green line, taken from Fig. 2). GFP translational motion below 2 × 10⁻⁵ s (corresponding to displacements in the 25–100 nm range) matches that observed in solution, indication of Brownian motion. Thus, it can be well described by the diffusion equation (χ2=0.42, P<0.01). However, the latter description does not apply to iMSD values above 2 × 10⁻⁵ s (χ2>>25, P>0.995) where a strong suppression in the GFP translational mobility is detected. (b) iMSD of GFP dimer in cytoplasm: double-logarithmic representation as average of N=2 experiments, n=9 cells (black dots). D0 (95±5 μm2 s−1) and Dinf (12±3 μm2 s−1) are estimated by a linear fit of the iMSD below 5 × 10⁻⁵ s and above 1 × 10⁻³ s, respectively. The green bars represent the GFP dimer iMSD measured in cell lysate and the green line represents the linear fit corresponding to Dw=105±4 μm2 s−1. Scale bar, 5 μm. Data are mean values±s.d.

