Fig. 1.
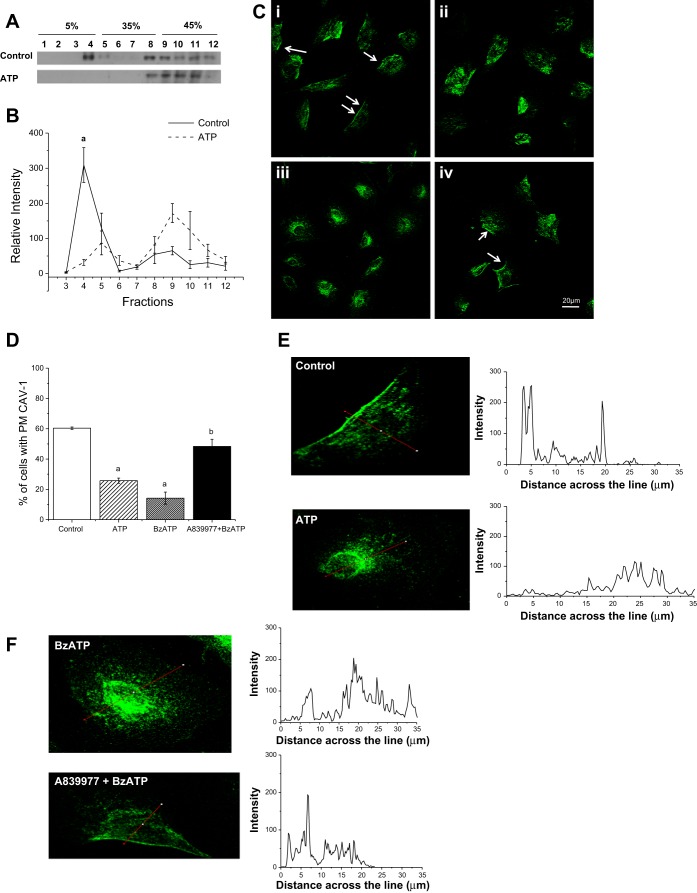
Activation of the purinergic receptor P2X7R induces CAV1 endocytosis. A: MC3T3-E1 cells were subjected to sucrose gradient centrifugation, and 1-ml fractions were collected from the top of the gradient and immunoblotted for caveolin 1 (CAV1). Addition of 250 μM ATP caused a translocation of CAV1 from the lipid fractions (fractions 3–6) to the denser cytosolic fractions (fractions 9–12), indicating loss of CAV1 from the plasma membrane microdomains. B: quantification of CAV1 translocation with ATP treatment shows a significant loss of CAV1 from the buoyant lipid microdomain fractions (fractions 3–6). aP < 0.01. C: CAV1 is present on the plasma membrane of MC3T3-E1 cells under control conditions (i, arrows), but the staining pattern was strongly reduced when the cells were stimulated for 10 min with 250 μM ATP (ii) or 150 μM 2′(3′)-O-(4-benzoylbenzoyl)ATP (BzATP, iii). CAV1 remained on the plasma membrane when the cells were pretreated with 500 nM A-839977 before addition of 150 μM BzATP (iv). D: percentage of control and ATP-, BzATP-, and A-839977 + BzATP-treated cells in which CAV1 is present on the plasma membrane (PM). There was a significant reduction in the number of cells with CAV1 on the plasma membrane within 10 min of ATP or BzATP treatment and a significant difference between BzATP-treated cells and cells pretreated with A-839977. aP < 0.05 vs. control; bP < 0.05 vs. BzATP (by Tukey-Kramer test). E and F: line profile showing intensity of CAV1 staining across the cell, as indicated by the red line across the cell. In control cells, intensity peaks on the membrane region and tapers down toward the inside of the cell. When the cell is treated with ATP or BzATP, the intensity profile is distributed across the cytoplasm of the cell, and the profile of A-839977 + BzATP is similar to the control.

