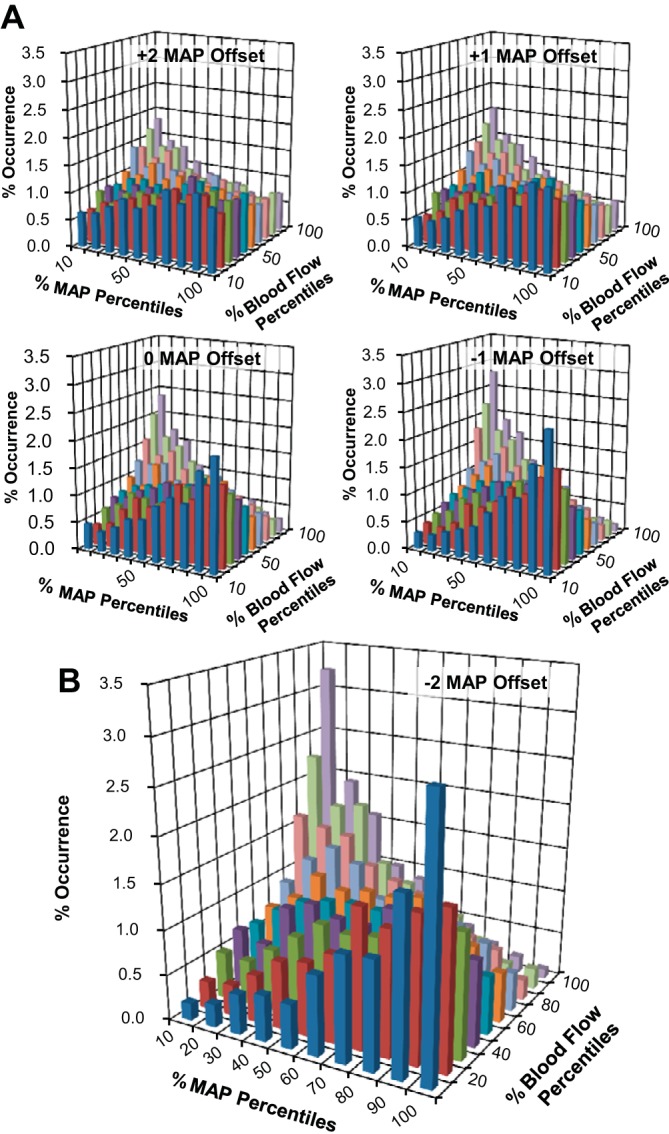
Fig. 3.

Bivariate histograms relating the relative occurrences of coincident data pairings between percentiles of MAP and forearm BF (protocol 1, n = 12). MAP offsets ranging from +2 to −1 heart beats are shown in A along with the −2 offset, which resulted in the greatest emerging trend (B).
